
Why Technical Analysis Works
And why you should learn the basics

Most debates around technical analysis miss the point. It’s not about using candlesticks, fibonacci’s or moving averages to “predict the future.” It’s more-so about the context, probabilities and human behavior.
Price action is the secret sauce for retail traders. Everything shows up in price: fundamentals, news, liquidity, and positioning.
If you’re investing, you can argue over valuations or macro narratives all day. But for active trading, price action is the language the stock market speaks.
Let’s explore a little more on why technical analysis (TA) works →
TA Represents History
TA doesn’t try to predict some theoretical fair value. It respects what the market is actually doing and what it has done. Markets are made of people. And people chase, panic, hesitate, get greedy, and get scared. Over and over again, year over year, day over day.
TA works because patterns of crowd behavior repeat. It’s not perfect and not always, but it’s just enough to give you a slight edge in the market.
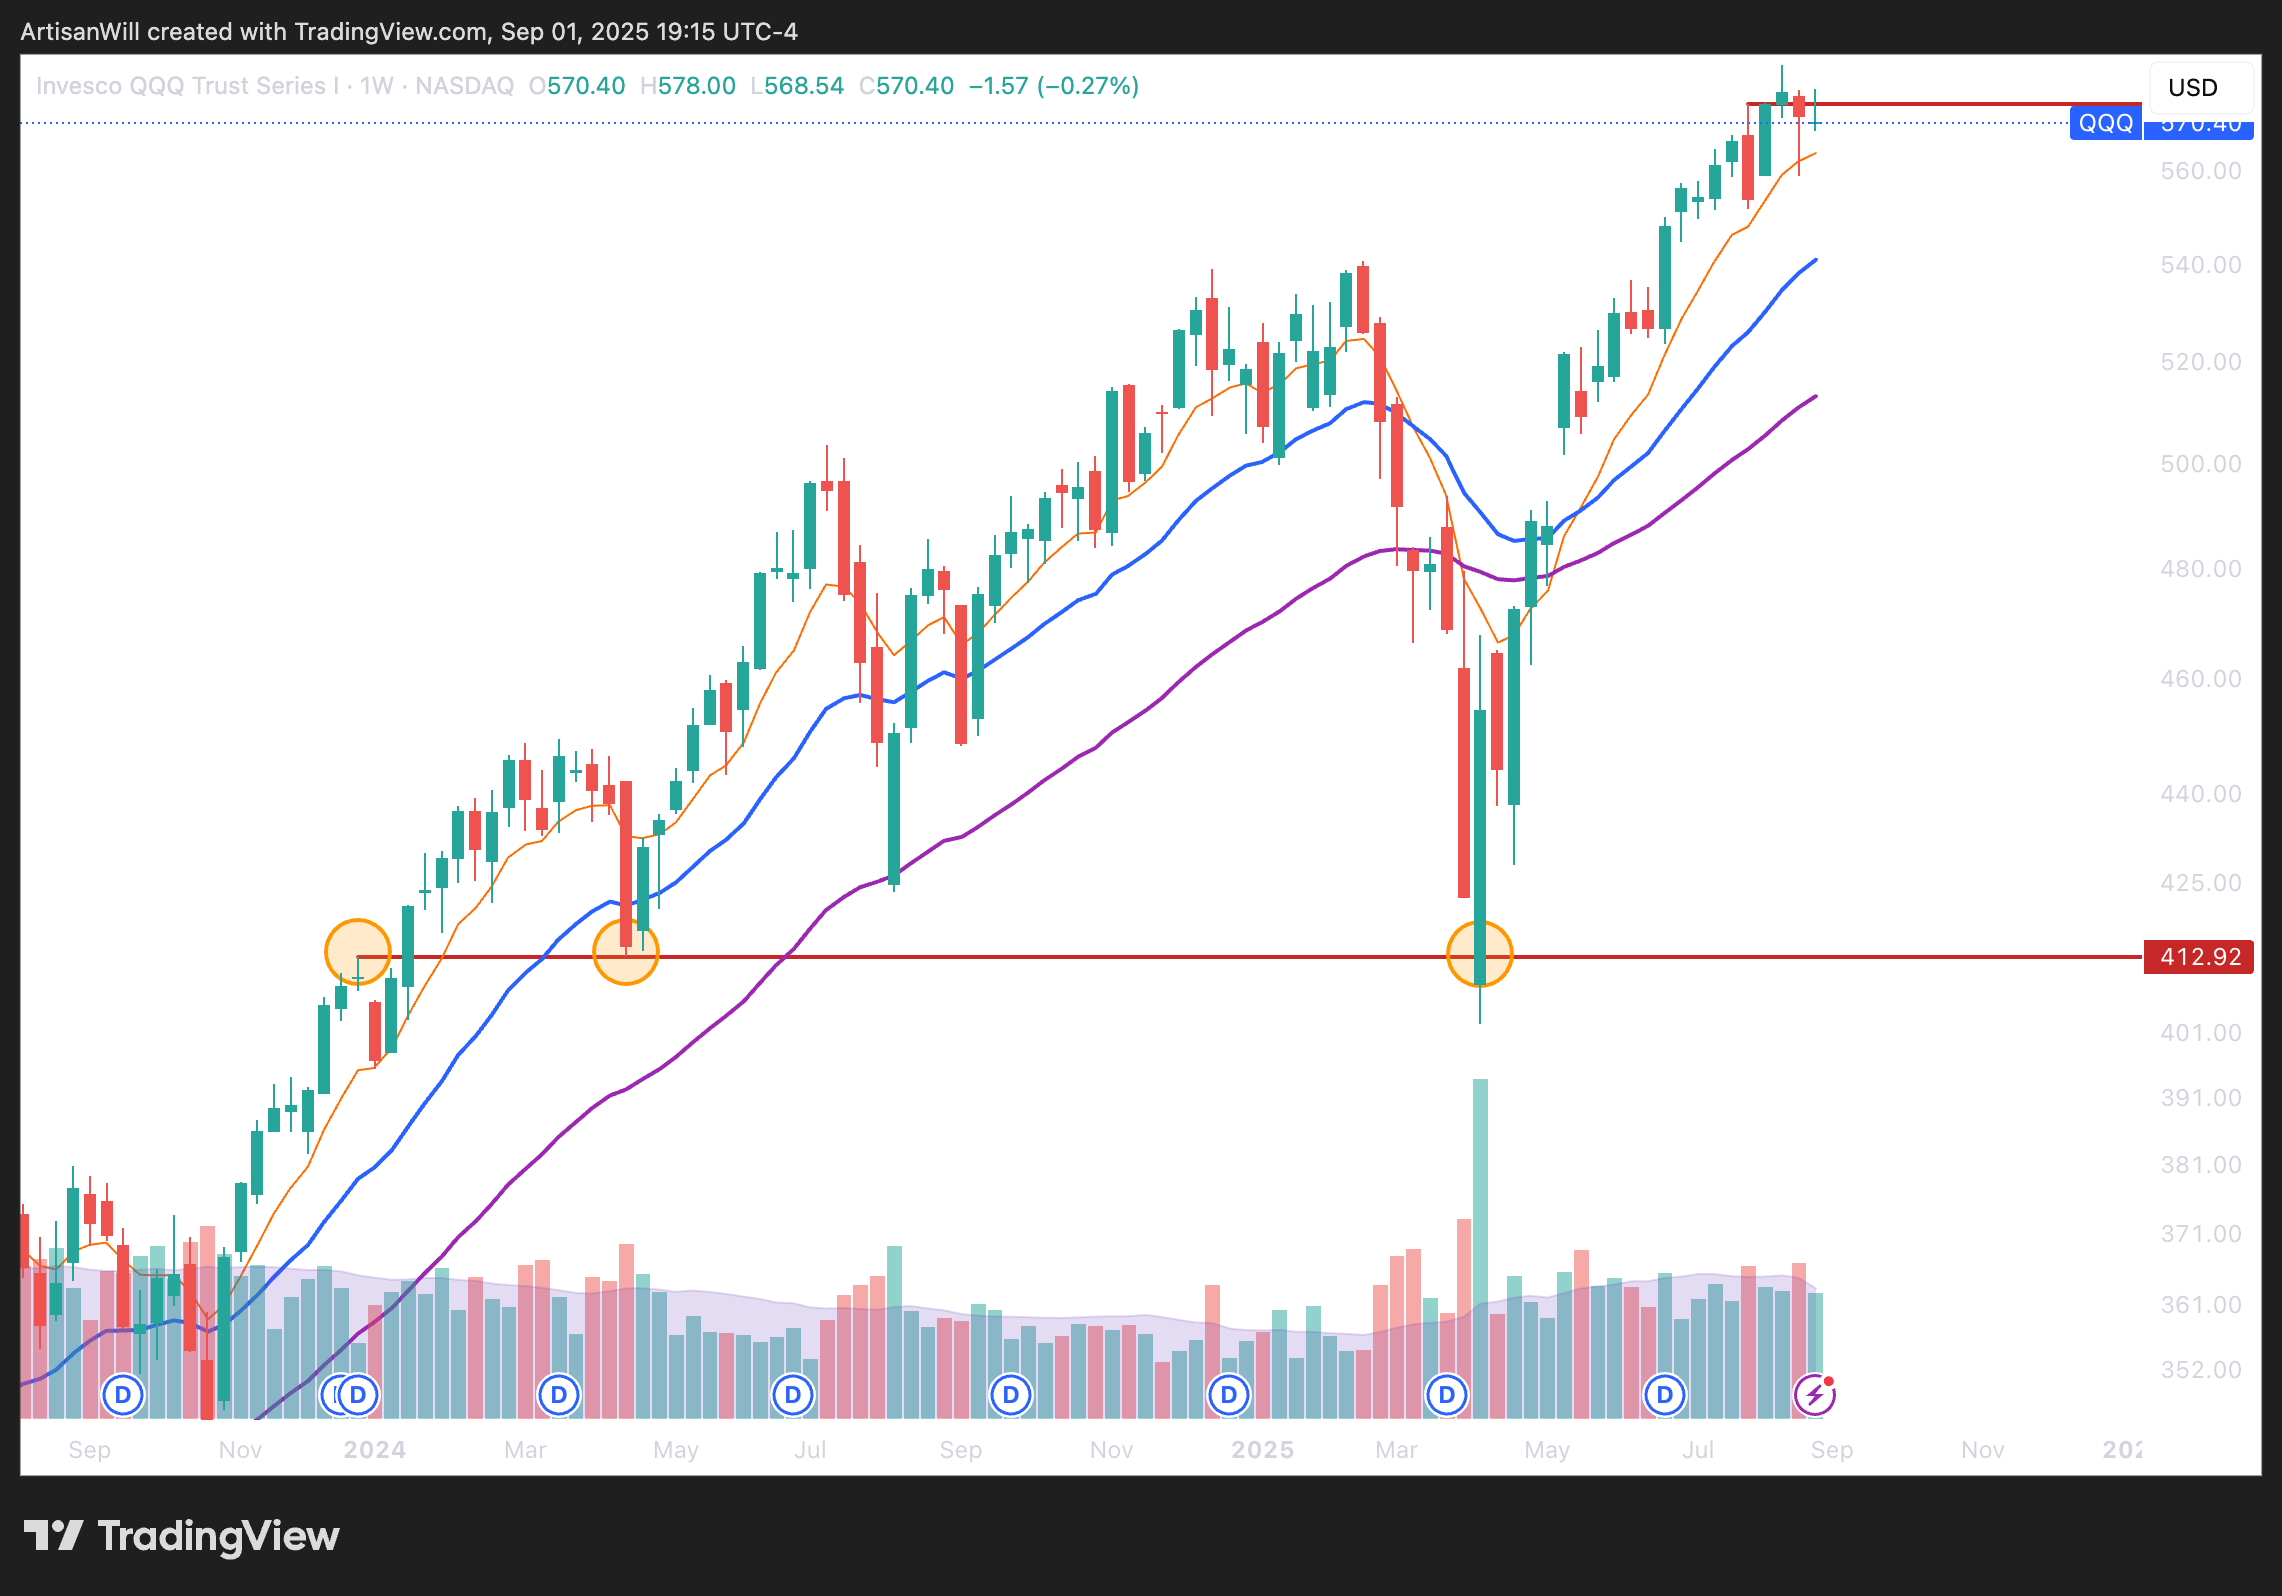
The most simple form of TA is Support and Resistance. It’s where memory lives. It’s where the crowd made decisions and will again.
I go more in-depth on identifying Support and Resistance here:


SPY 0.00%↑ on the weekly shows $413 as a previous ATH level that was used as support twice. The first bounce was an almost perfect tap of the $413 level whereas the second bounce isn’t as clean. But it still gives you a rough idea of where it might be good to buy and how to define your risk in the market, barring black swan events of course.
TA is a Risk Framework, Not a Crystal Ball
Technical analysis isn’t about predicting what will happen. It’s about defining:
What’s happening now?
Where am I wrong?
Where do I get paid?
Every setup has an entry, invalidation, and target. This is what’s known as a trade plan, and this is how you hold yourself accountable in the market. Instead of aimlessly buying and selling, TA allows you to define your risk and take profit levels.
A really good way to view it is that TA gives you a map but you still have to drive. If there’s a blockade on the road, it’s your job to maneuver around and find a different path on the map.
What’s happening now?
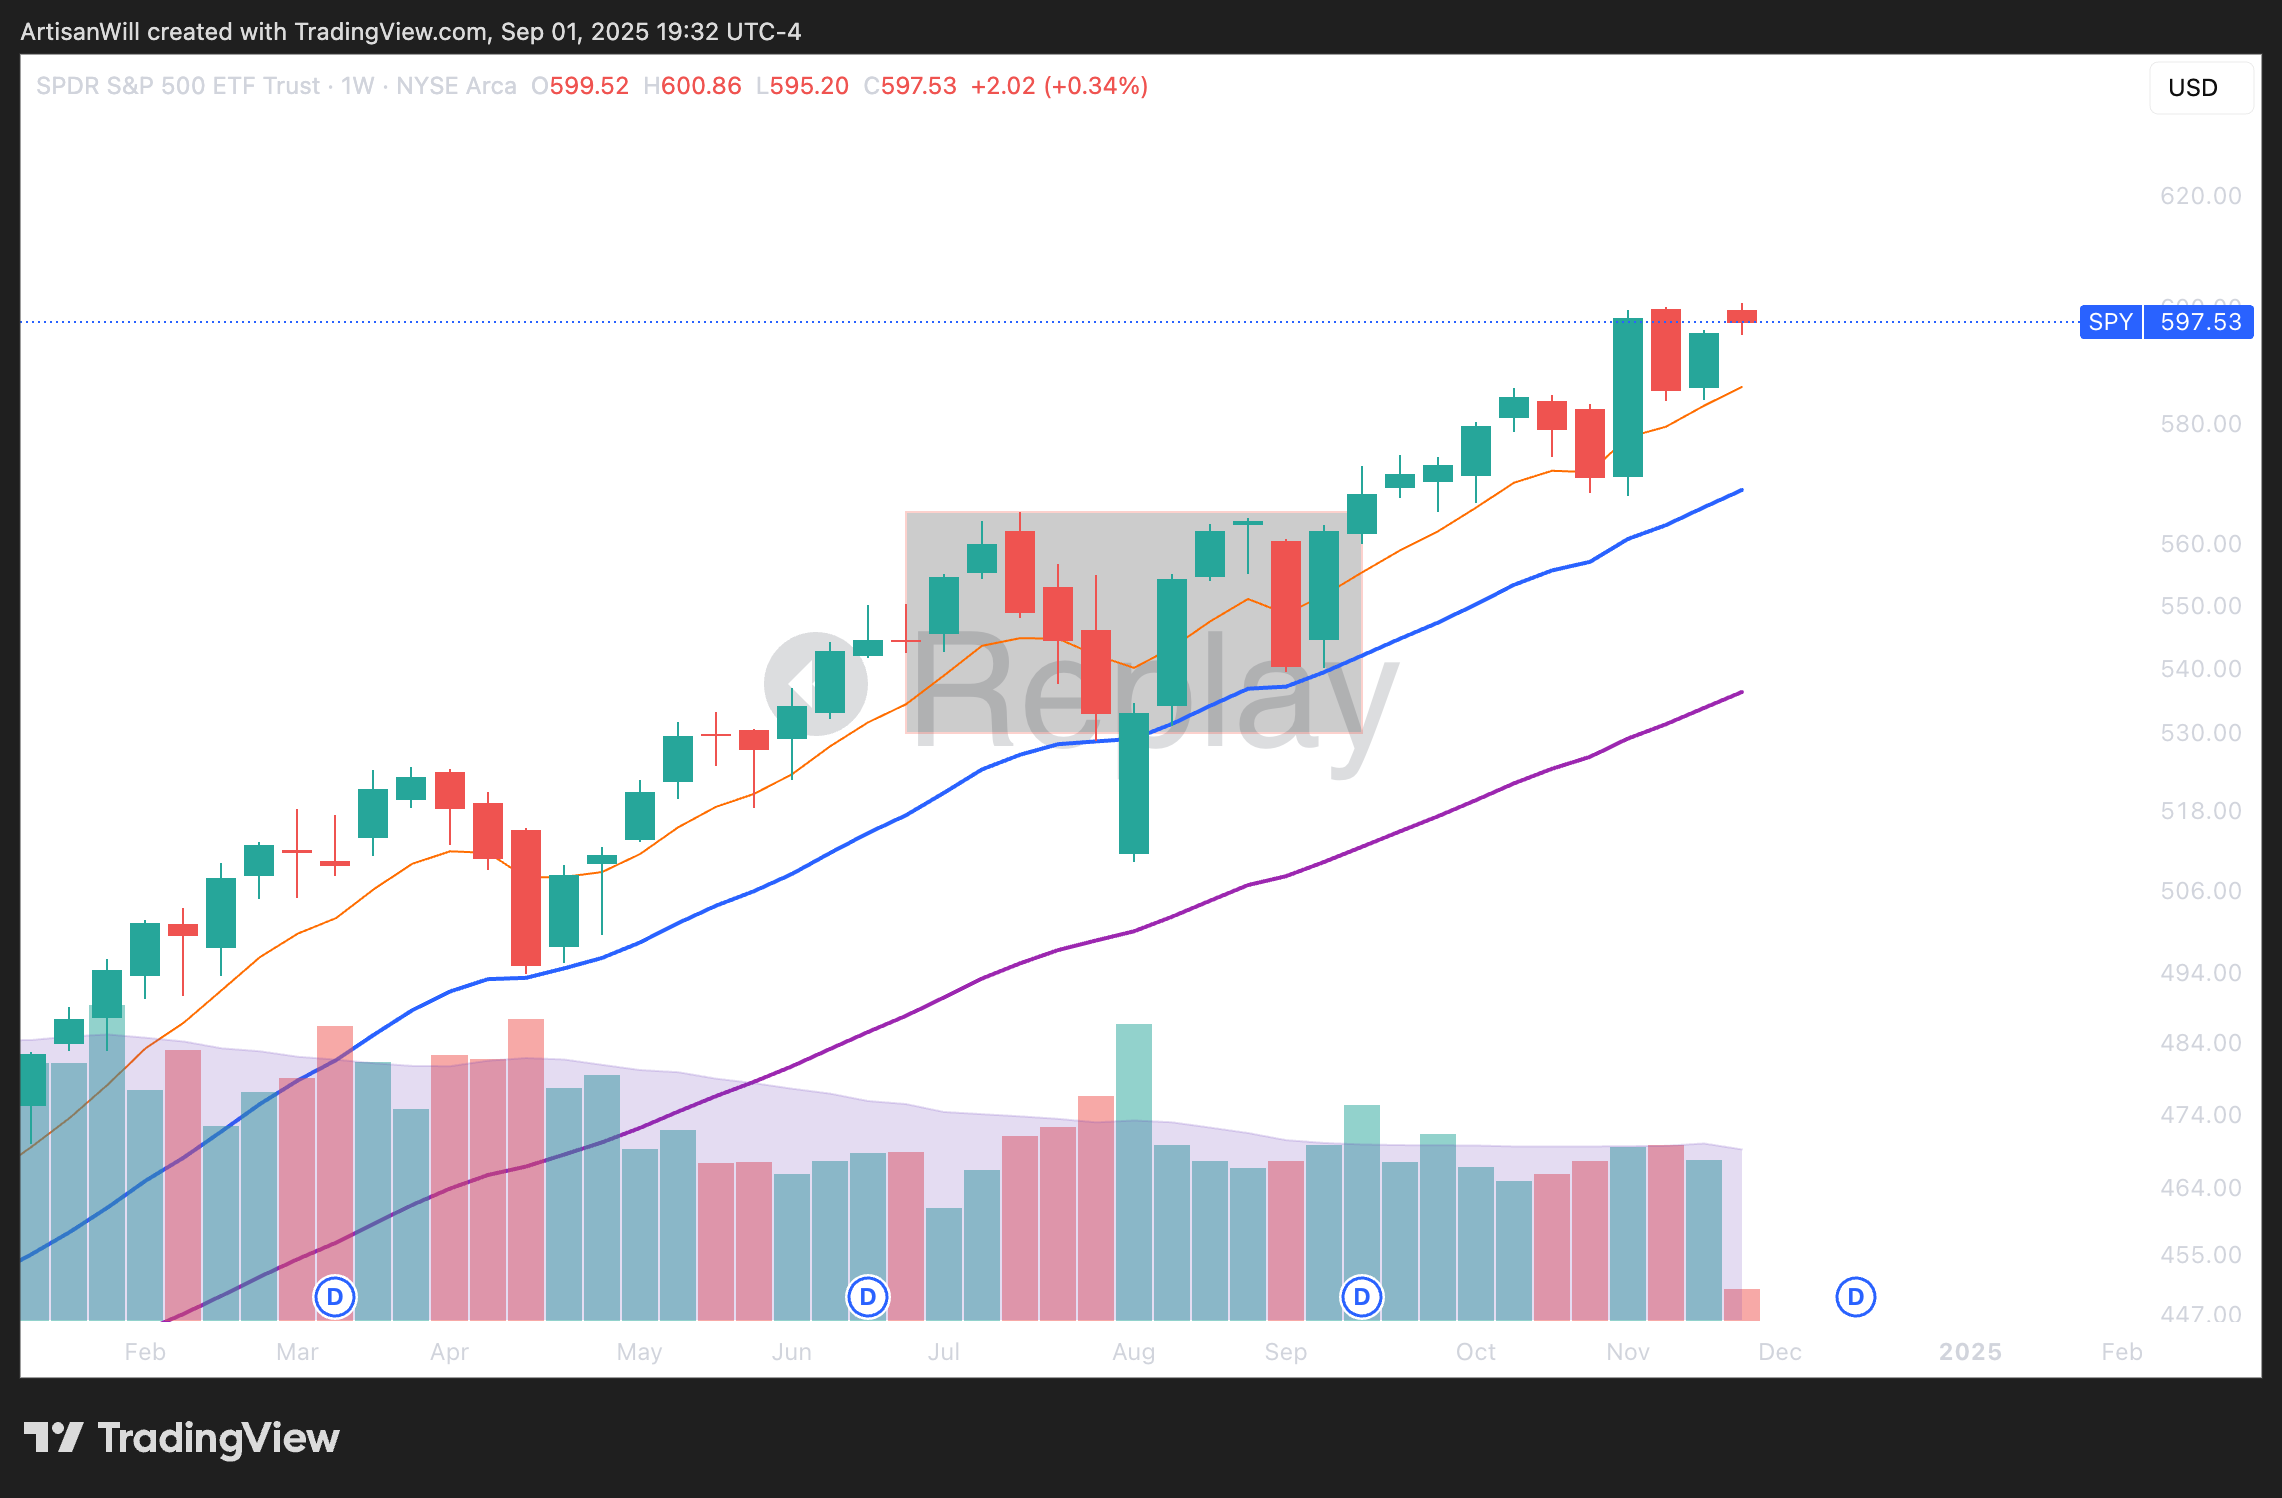
Barring the anomaly green candle in the middle of the highlighted rectangle, this price action shows you that the market is consolidating and choppy. It’s a huge range, but despite all the weeks that have passed, the market hasn’t made substantial gains nor losses. It hasn’t picked a direction.
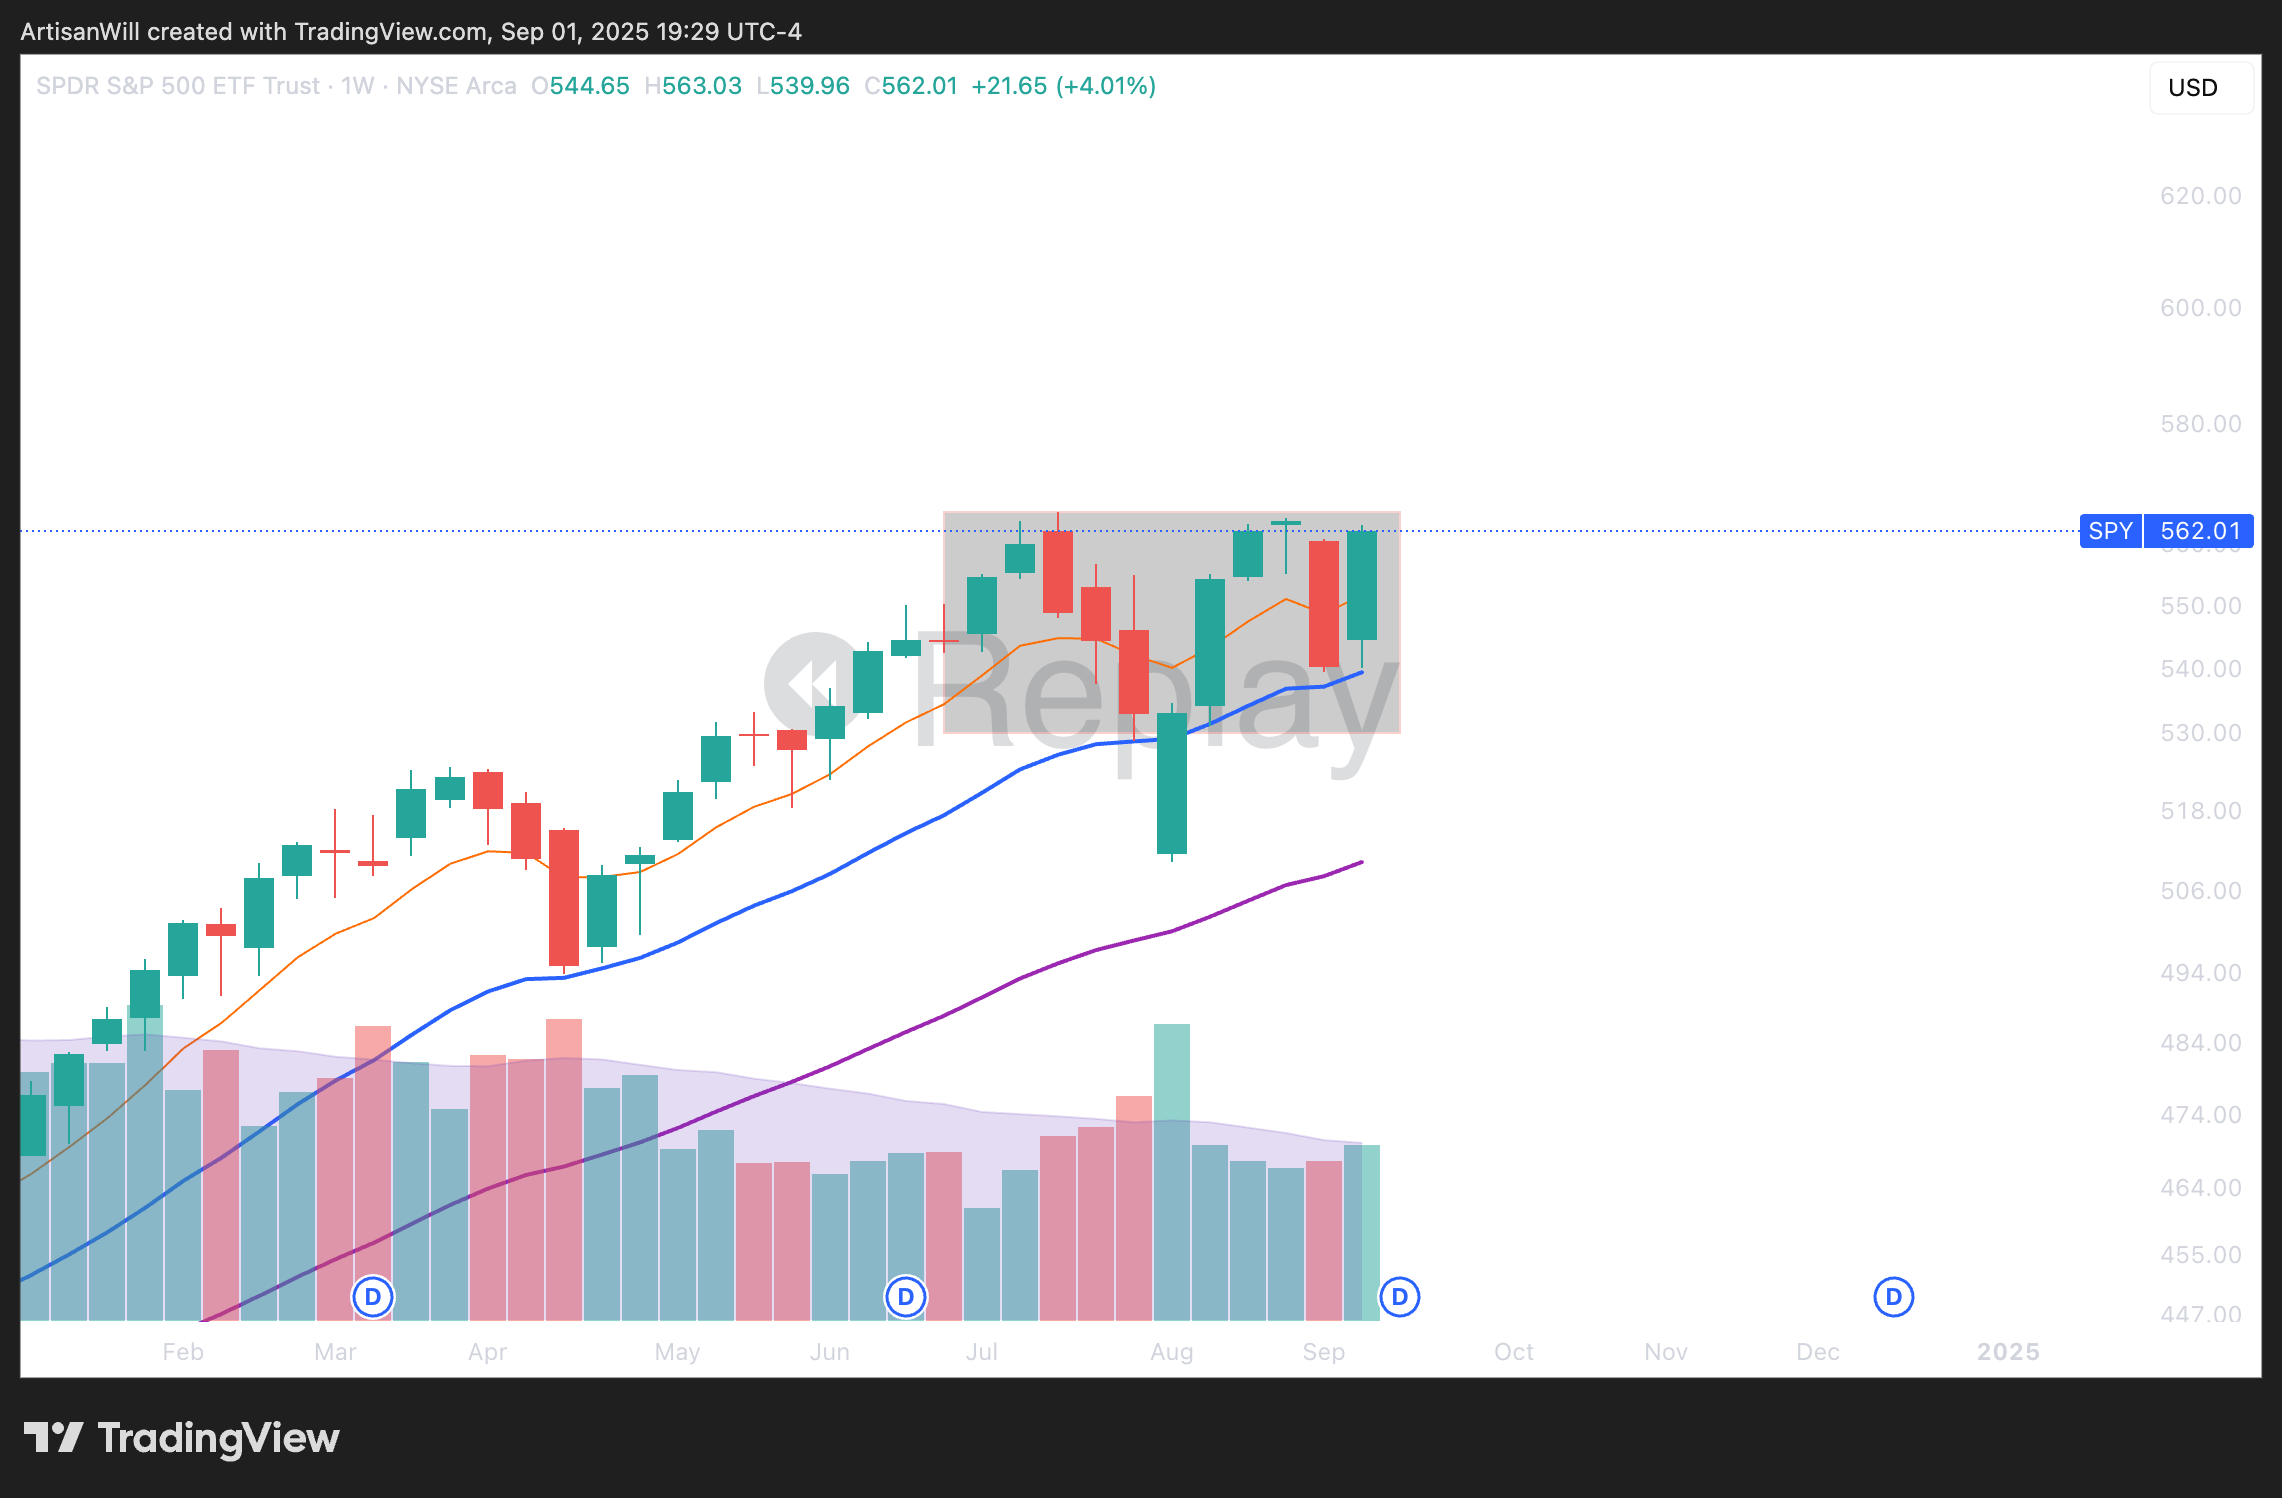
But, previous price action shows that there was a huge rally beforehand. Consolidation in uptrends tend to resolve to the upside, and that’s exactly what happens here.
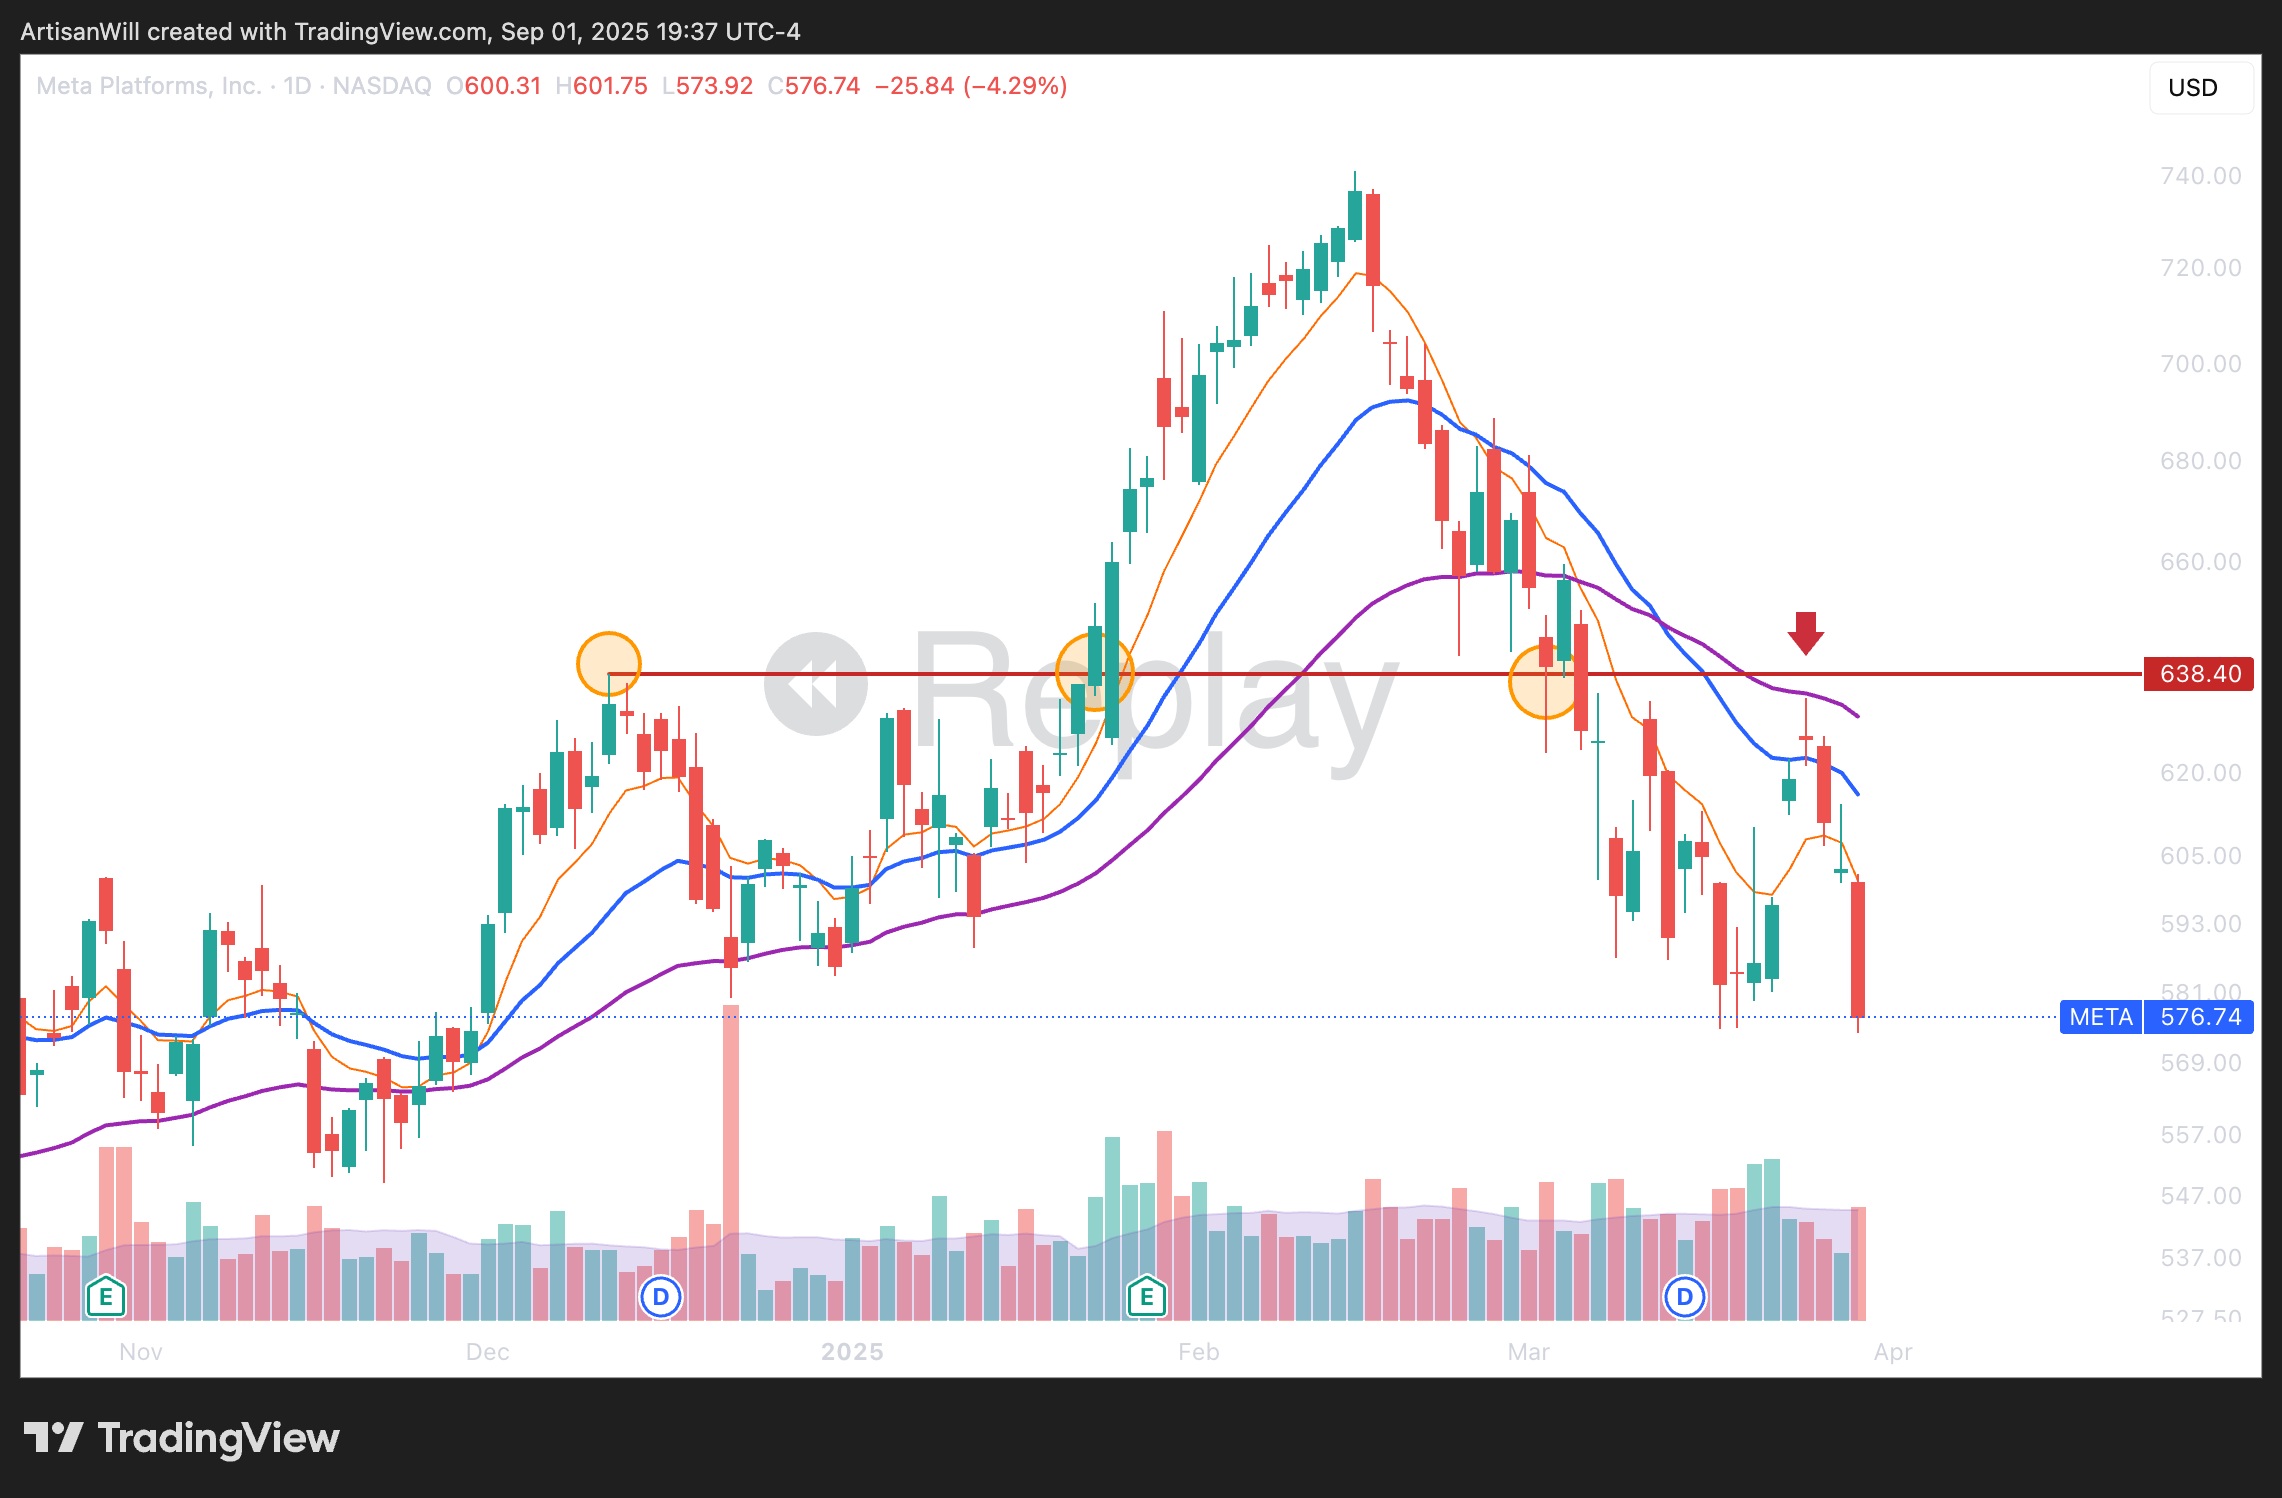
Where am I wrong?
A key premise of price action is that previous resistance should be turned into new support for continuation. Failure to hold these levels results in a change of character and is a clear signal to you that you are wrong.
META 0.00%↑ on the daily time frame here shows an ATH break that took two tries for continuation. On the pullback, price establishes a vital bounce point based on previous resistance.
This is a spot where your risk is well defined if you’re attempting a long: a daily close under this previous ATH level is a negation of your long thesis.
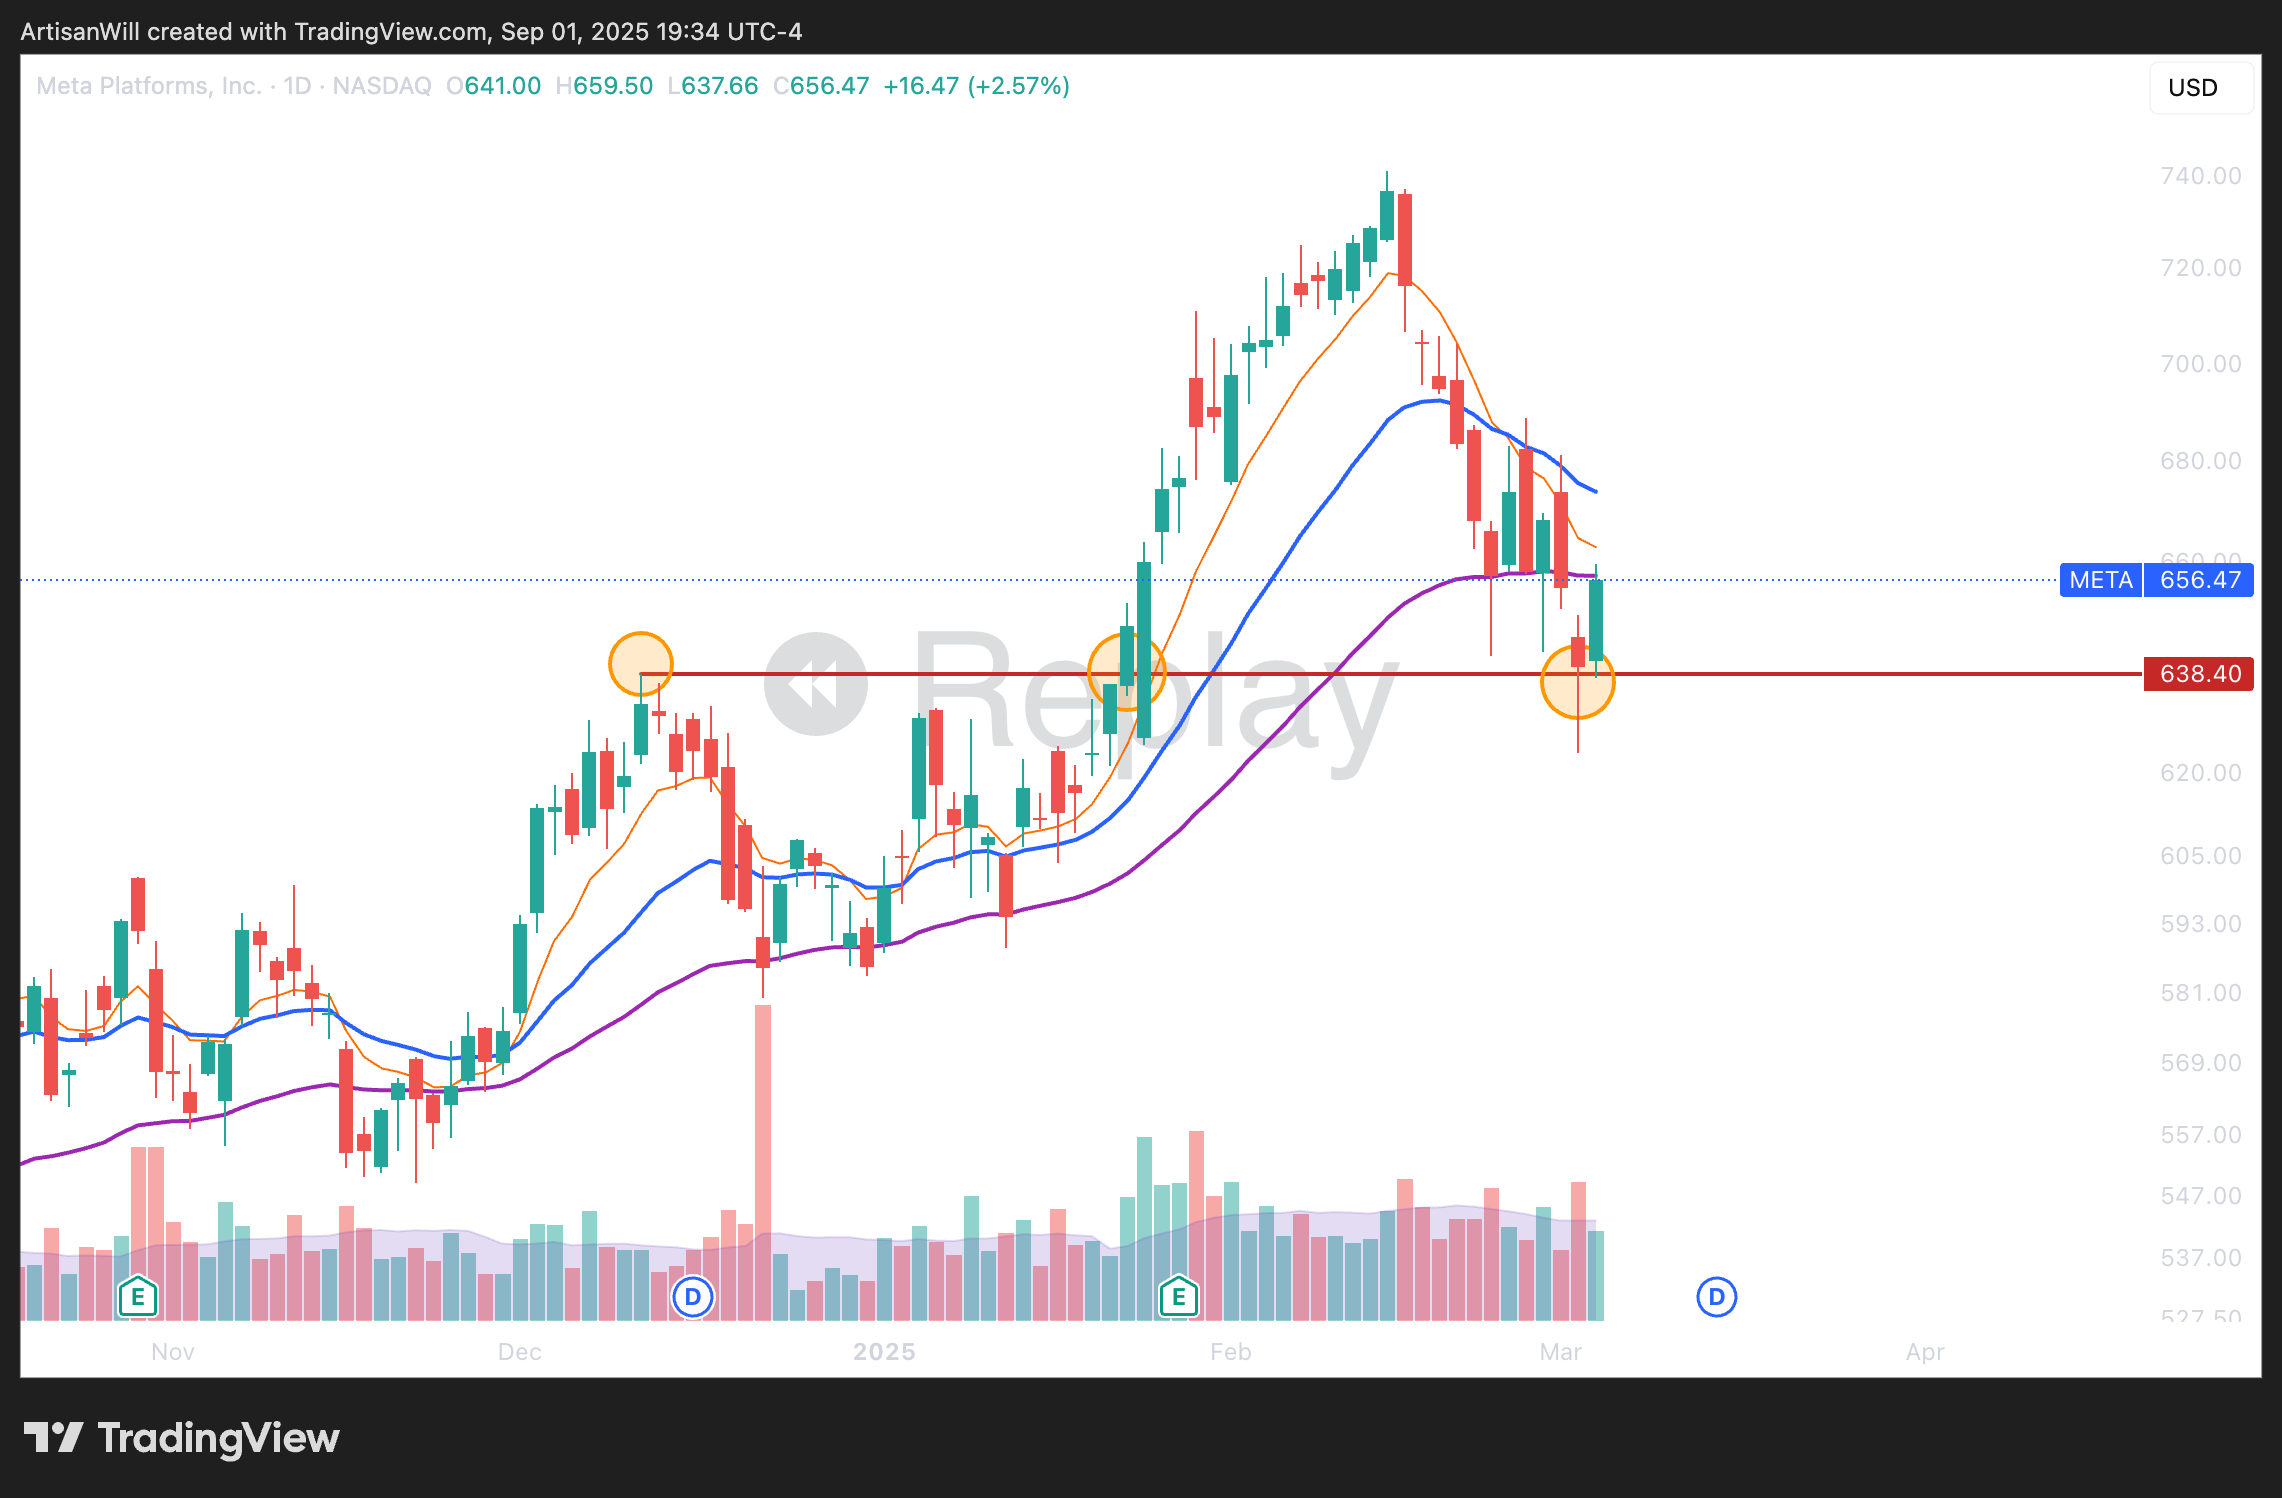
Once this level breaks though, it’s a clear indication that you are wrong. Price even on the red arrow to the right attempts to reclaim the 638 level but rejects harshly.
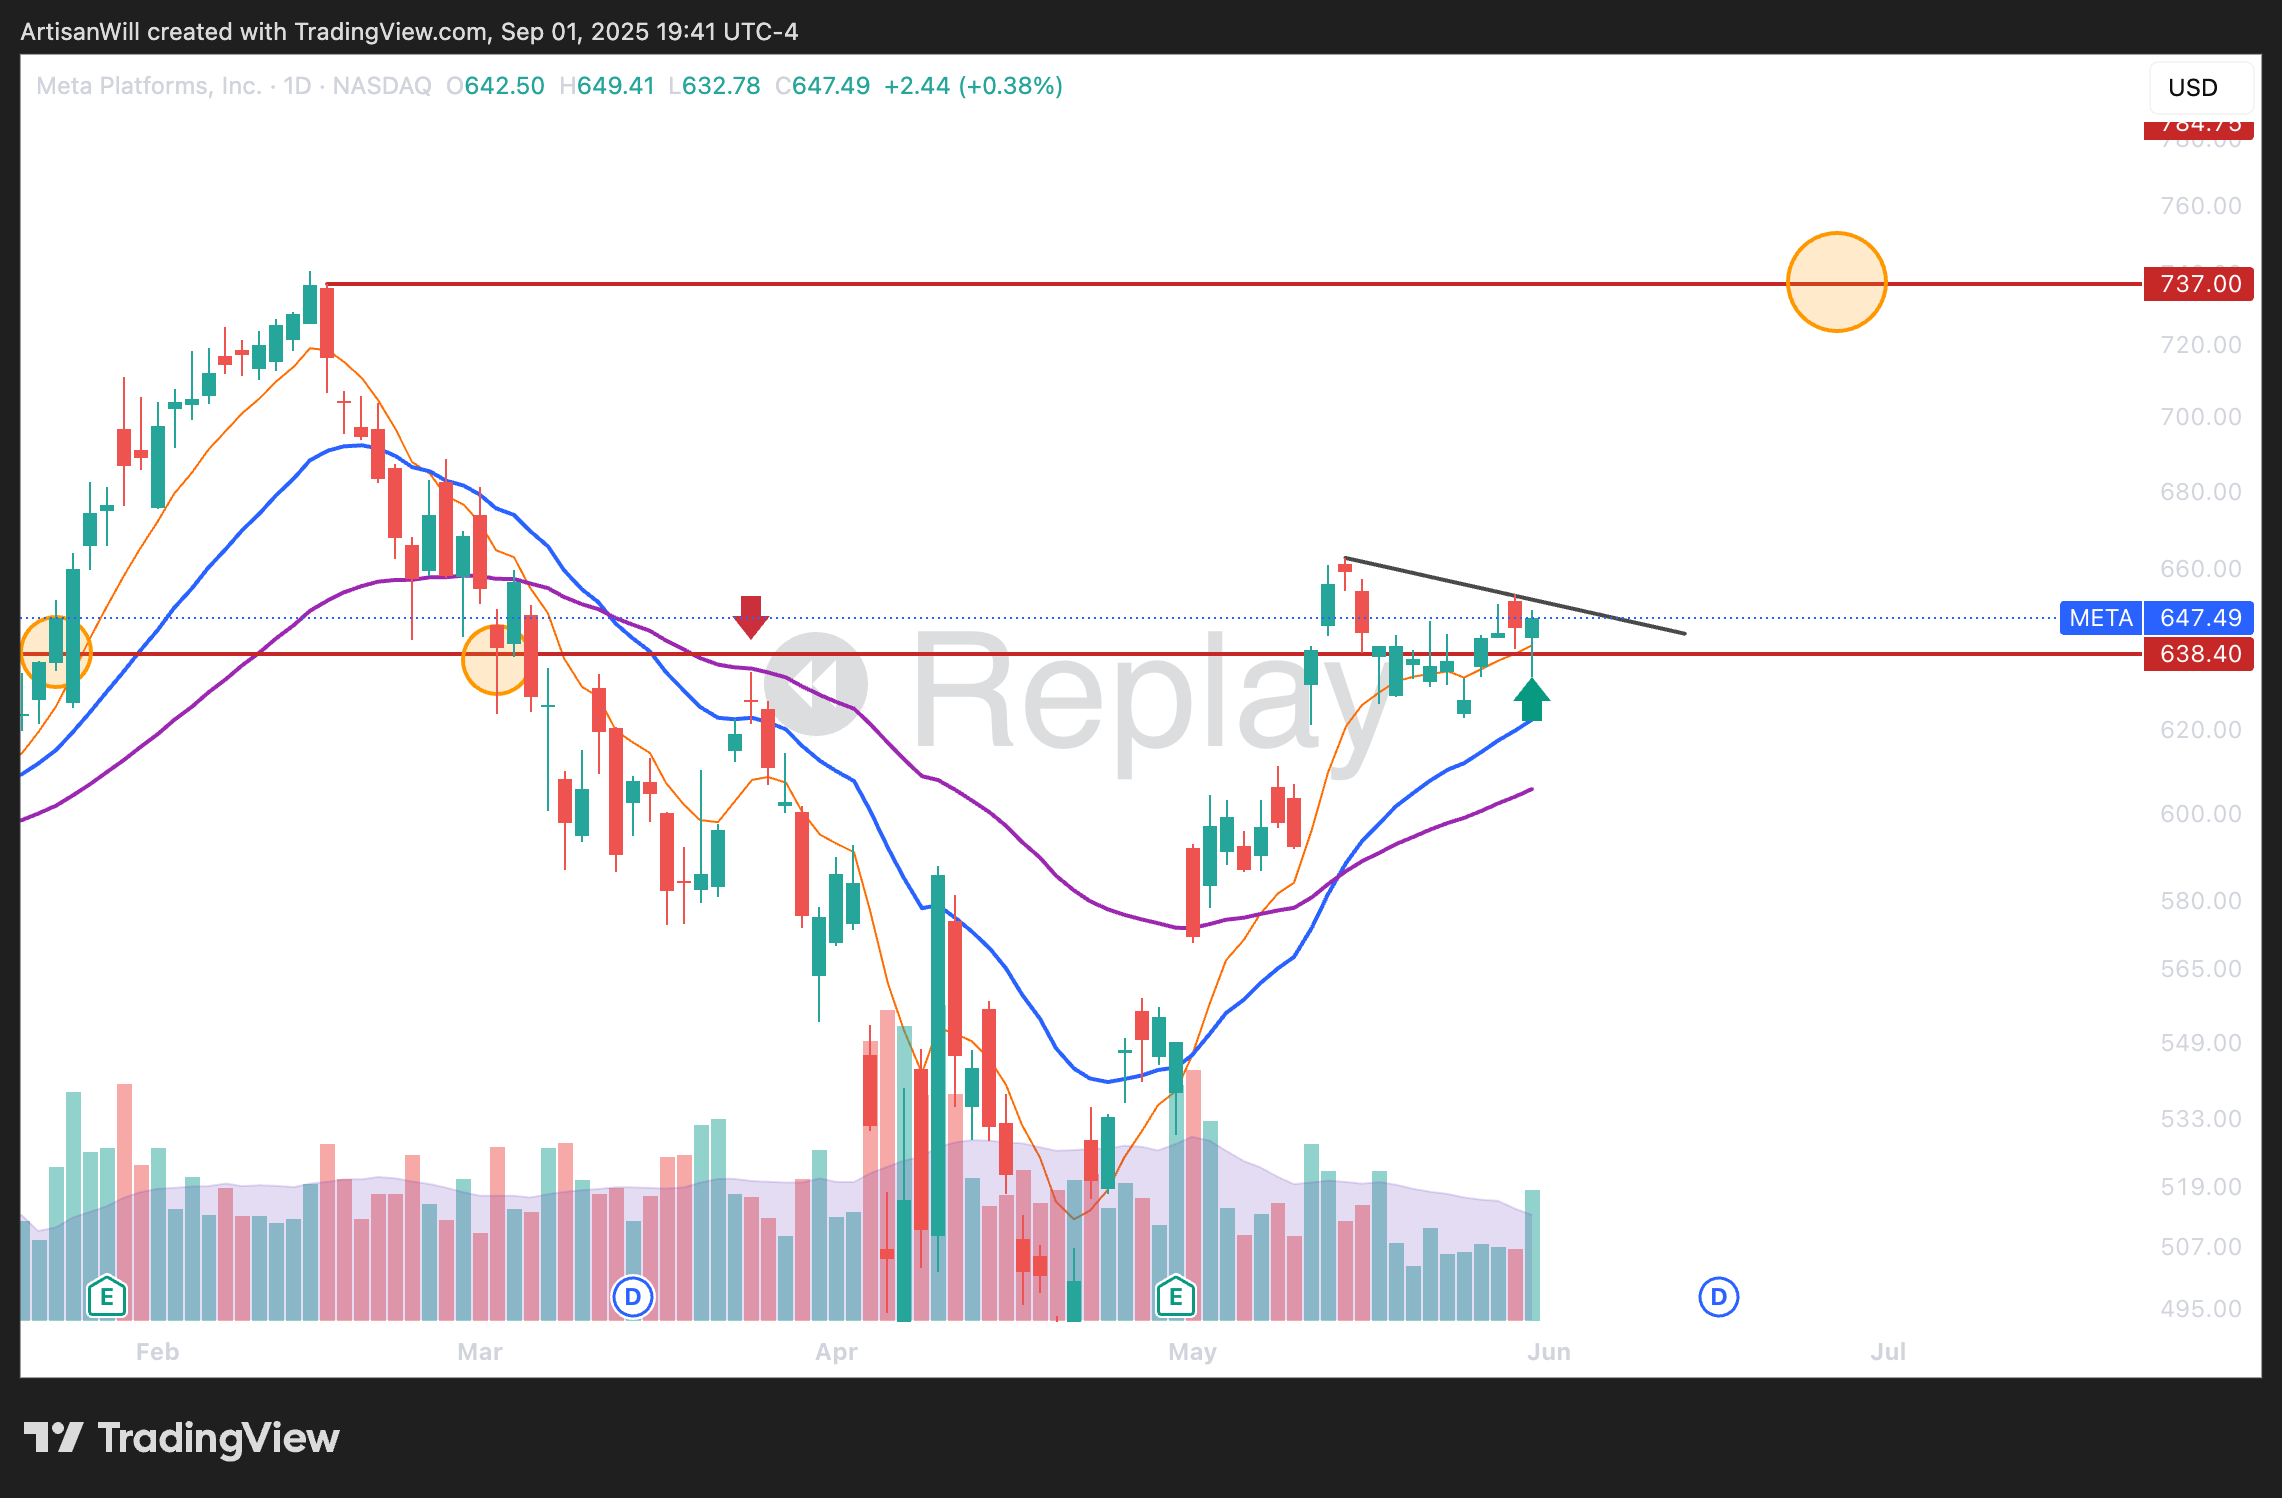
Where do I get paid?
The best charts to trade are the ones where the stock has previous levels to target as take profit areas. It’s a little bit more difficult when stocks hit new ATHs and are in price discovery. The rule of thumb for ATH stocks are mental numbers like whole numbers (i.e. 100).
META 0.00%↑ below has reestablished constructive price action above that 638 level that it struggled with for so long. This consolidation at these levels show that market participants agree this is a fair price to pay for the stock.
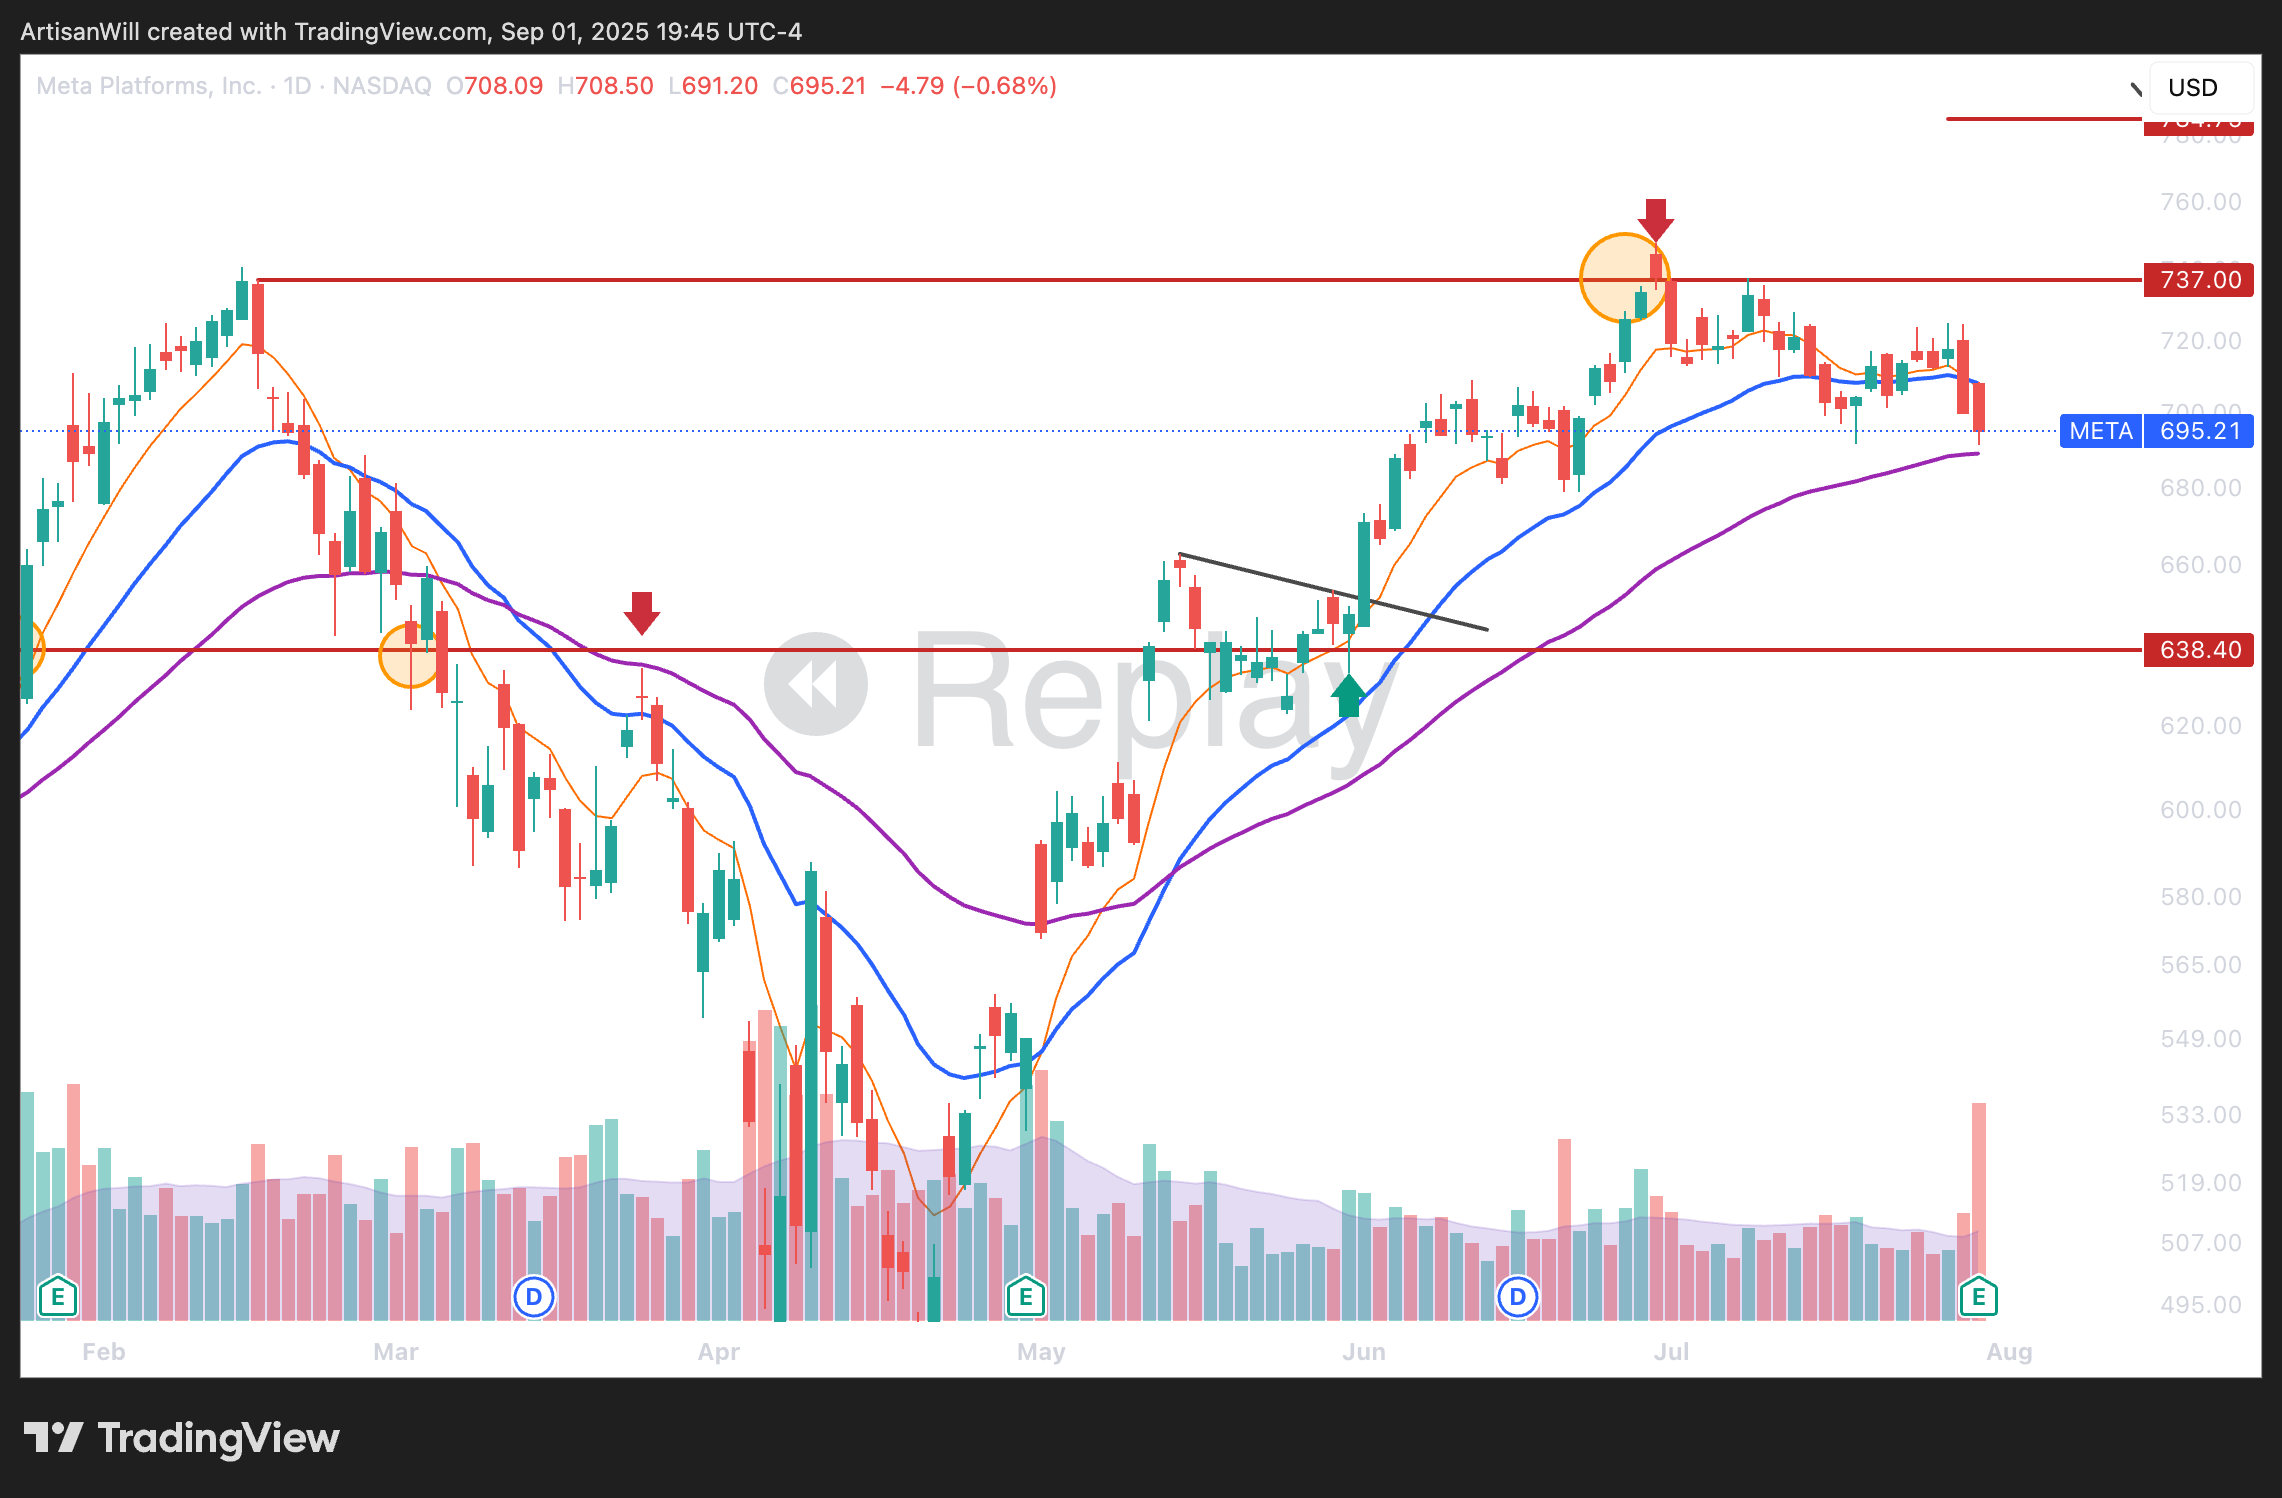
Trend line resistance is also a great setup to trade for potential breakouts past it. You would target previous levels so you could aim for the 737 area.
META 0.00%↑ hits the 737 level in a short while, which is where you get paid. Conveniently, that’s also where momentum stalls and price begins to pullback.
What about Algorithmic trading?
The problem is that the majority of algorithmic strategies or finding an inefficiency in the market will get arbitraged away once you try to scale up. There are exceptions, but these types of strategies relies on boat loads of data as well as complex deep learning (which for us average joes like you and me just isn’t possible to do as effectively).
Even the best out there, the Medallion Fund, caps their AUM at $10 billion. This is likely because their algorithmic strategies don’t work as efficiently in higher scale and to avoid slippage. The fund touts a 66% gross annual return over the past ~30 years.
And the craziest part? The employees aren’t investment bankers or high frequency traders. All of the employees have PhDs in math, physics, and computer science.
Aside from a few outliers like the Medallion Fund, only around 10% of large actively managed funds actually beat the S&P500.
I’m not saying you need to reach the caliber of the Medallion Fund to be successful trading, it’s all about swing trading in the right market environment. This means not trading or going less size when market conditions are not as favorable to reduce drawdown.
Final Thoughts
TA does not guarantee wins but it gives you structure and context. You’re able to operate with discipline and direction in a chaotic environment. Trading is a lot harder when you don’t have parameters set in place for risk. It can feel aimless and endless, but technical analysis helps clarify things. It’s never going to be a surefire bet or always work, but TA allows you to lean on probabilities and take advantage of what the market offers.