Options Trading - Top Down Guide #1
Part 1 - back to the basics
This next series will be a little bit of a deviation from the usual financial analysis, but if you’re interested in diving into financials of a publicly traded company, you’re likely also interested in trading stocks which requires some knowledge that isn’t taught in your typical finance discussion.
Here’s my controversial take for retail traders: ICT methodology and super crazy technical analysis is absolutely bogus for the majority of people.
Of course, there’s nothing wrong with sticking to a strategy if it works for you. By all means—more power to you if you can make it work consistently over time. The biggest problem, however, is that the majority of people won’t be able to replicate that type of success over a long period of time. If anything, proper risk management is way more important than having a vast knowledge of “technical analysis.”
This guide will be the most beneficial for swing trading. The fact that trading is a zero sum game becomes glaringly apparent when trying to day trade/scalp. There are too many other parties that have better tools and quicker access to news and data than you do. It’s simply too difficult to consistently be profitable.
Also, most of the stock market’s gains are made overnight. Swing trading (holding for at least one night) lets you set yourself up to be in higher probability positions to capture those overnight gap up/gap down moves. The whole objective of trading is to position your capital to be in positions that have a high probability of the stock price doing what you’re projecting. You do this over and over again for the rest of your trading journey. It won’t be flashy and exciting, but rather it’s a system that works consistently over time.
You will need to first know the basics and build a strong foundation, which is exactly what we’re going to do here! Price action is superior, which will be the primary focus. This is not financial advice, again, this is my journal of my thoughts and I am sharing what I have learned.
In this part 1, we’re going to cover:
→ Reading Candlesticks
→ Support & Resistance
→ Trendlines
Reading Candlesticks 🕯️
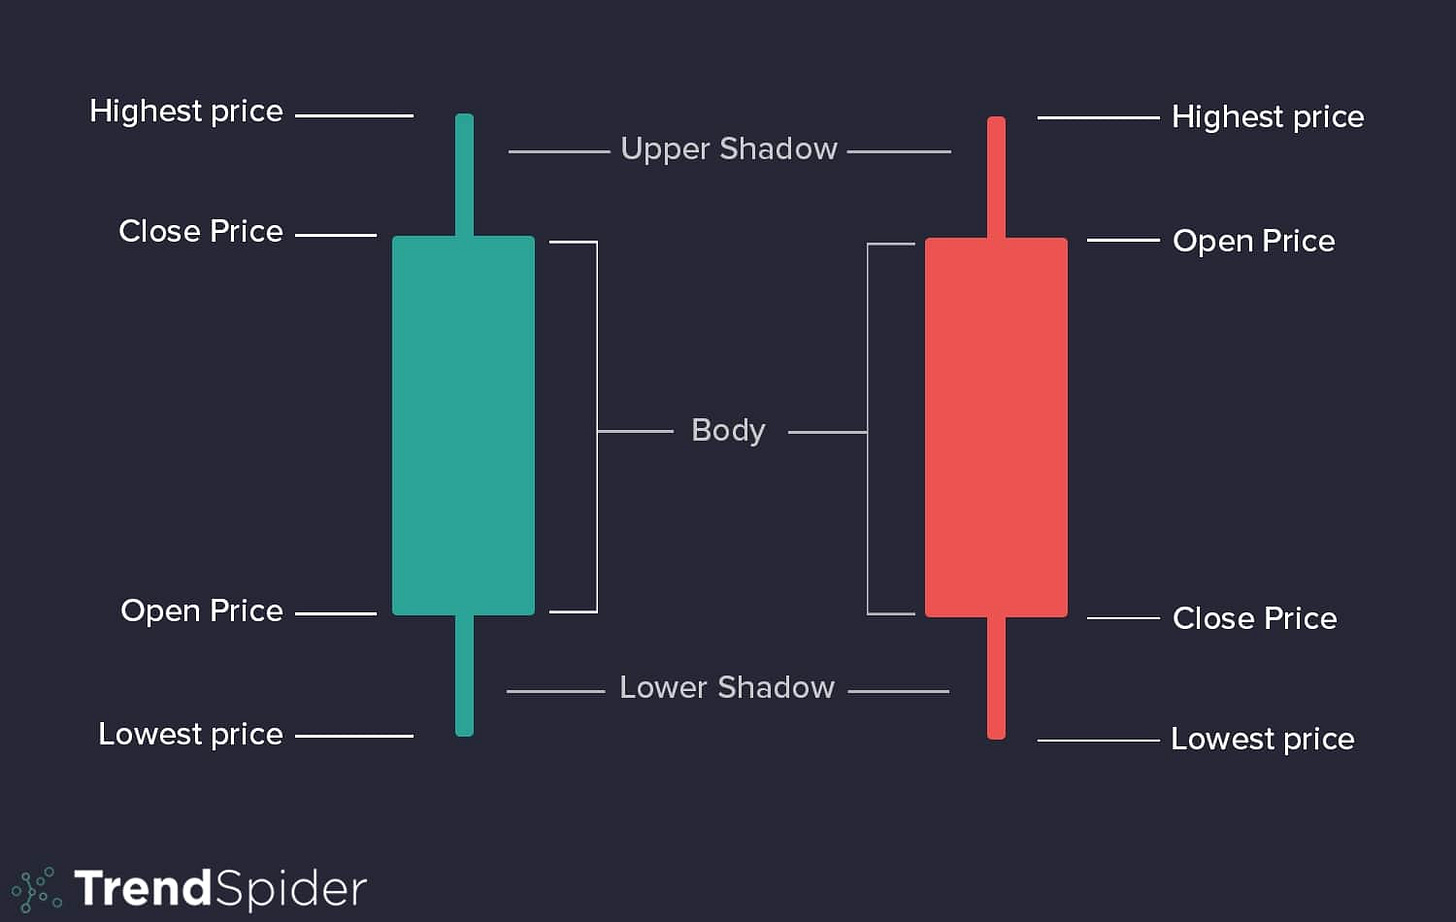
The line chart that Yahoo Stocks and Apple’s stocks app provides very limited information on what’s actually happening the price of a stock. The differentiator is that the line chart only shows you closing prices. You’re missing out on the open price, lowest price, highest price, and close price. Candlesticks give you all of this information, which can be viewed in different time frames too.
Courtesy of TrendSpider, here’s a visual representation of candlesticks:
Having price visualized through candlesticks can help you identify market sentiment based on some patterns that commonly occur.
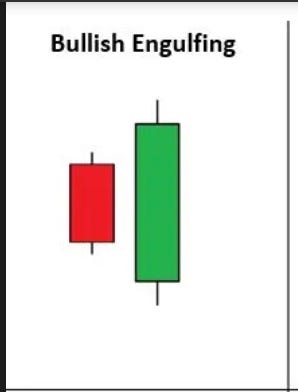
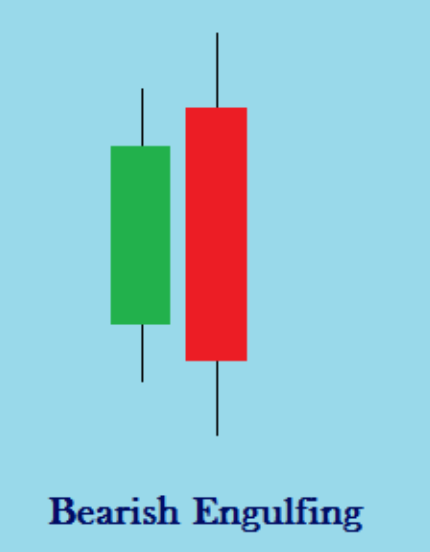
Bullish and Bearish Engulfing candles are some of my favorites to observe. For example: Bullish Engulfing candles show buyers took control and overwhelmed sellers to propel price to new highs. The inverse would be the same for bearish engulfing candles. These observations in the market don’t give a guarantee, but sets you up to position yourself in higher probability scenarios.
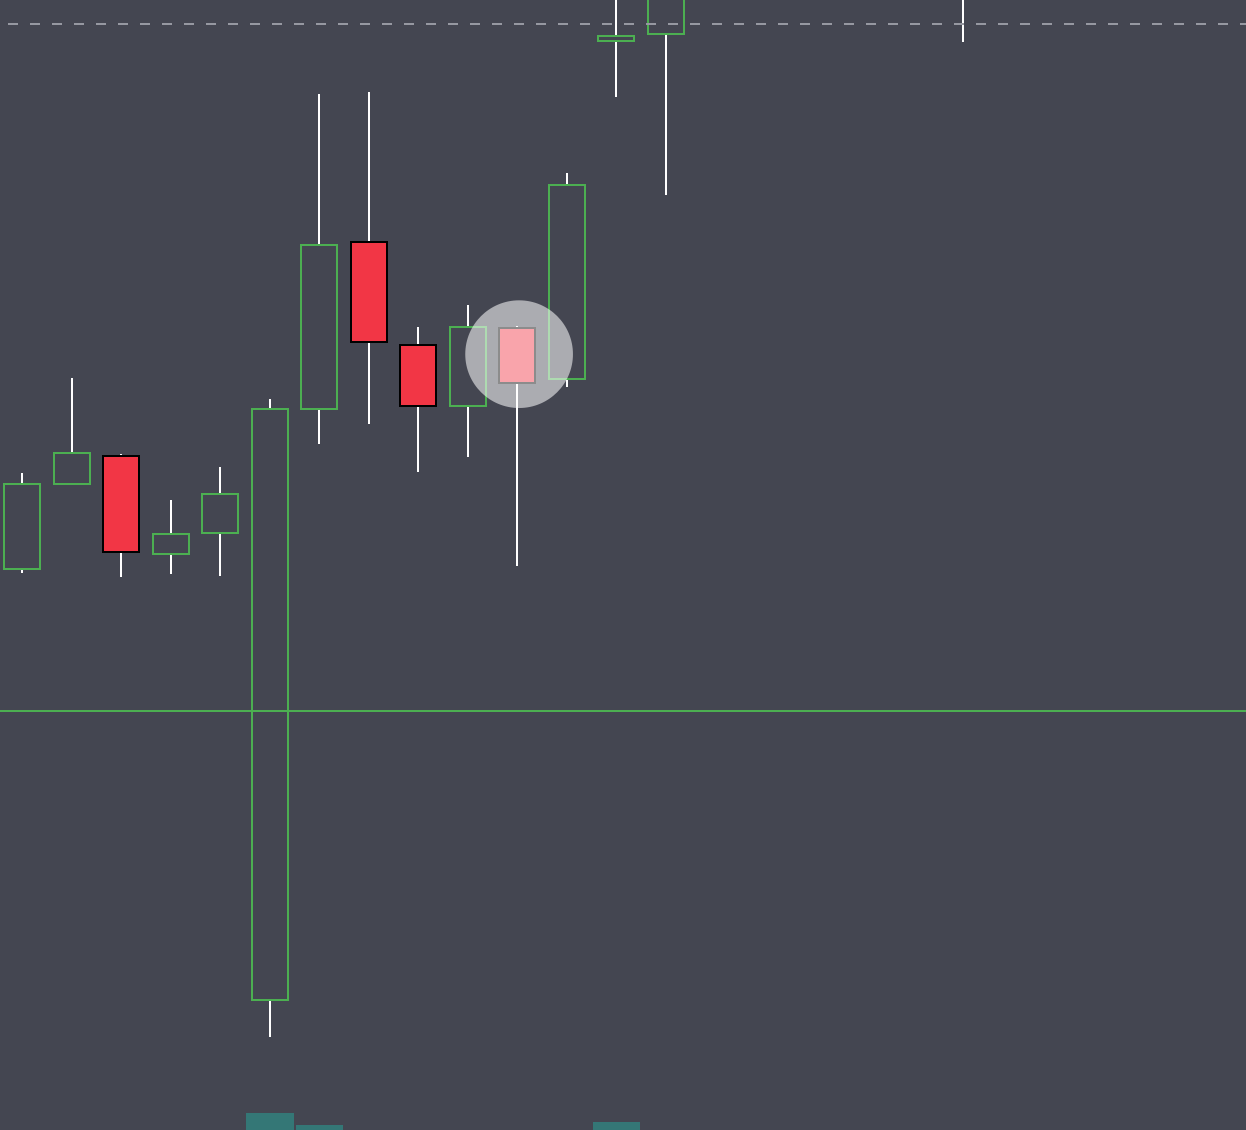
Another commonly known candlestick pattern is the bullish hammer:
Sellers tried taking control with lots of selling but by the close of the candle, buyers lifted price back all the way up. This usually indicates more upward momentum in price.
Support & Resistance ↔️
This is where things can become a bit more subjective. The important thing is to utilize multiple tools as a checklist for confluence for a potential trade.
Support: Price range where buyers are likely to have control. This is a price area where you expect the stock price to bounce from. Think of this like a floor where buying pressure is strong.
Resistance: Price range where sellers are likely in control. This is a price area where you expect the stock price to get rejected from. Think of this like a price ceiling where selling pressure is dominant.
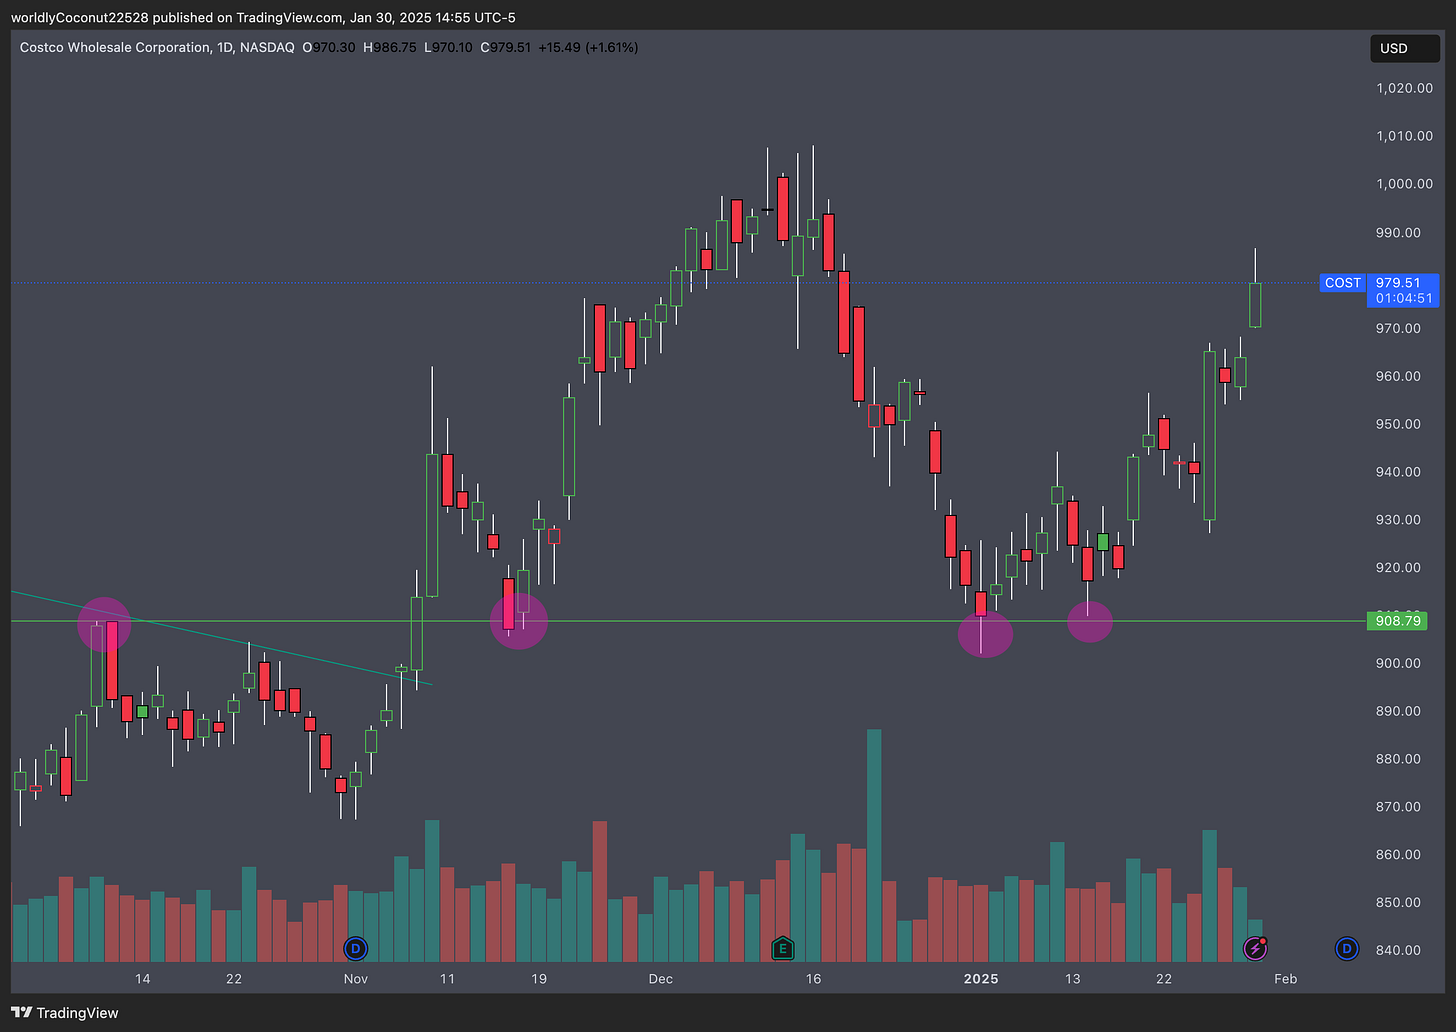
Example: COST 0.00%↑
This is a great example of resistance for price on the far left, where price rejected pretty aggressively. At that point in time, $908 area was a place where there were more sellers than buyers. After price broke past that resistance point, it become a great support area, where price touched three times and used it as a baseline to bounce back upwards.
These areas of support are really powerful because they provide excellent opportunities to enter long positions. Instead of panicking about price dropping, you want to be reframing your thought process to: “is this a potentially good spot to enter a trade?”
Support and resistance zones are great indicators that can help provide the answer.
Trendlines ↕️
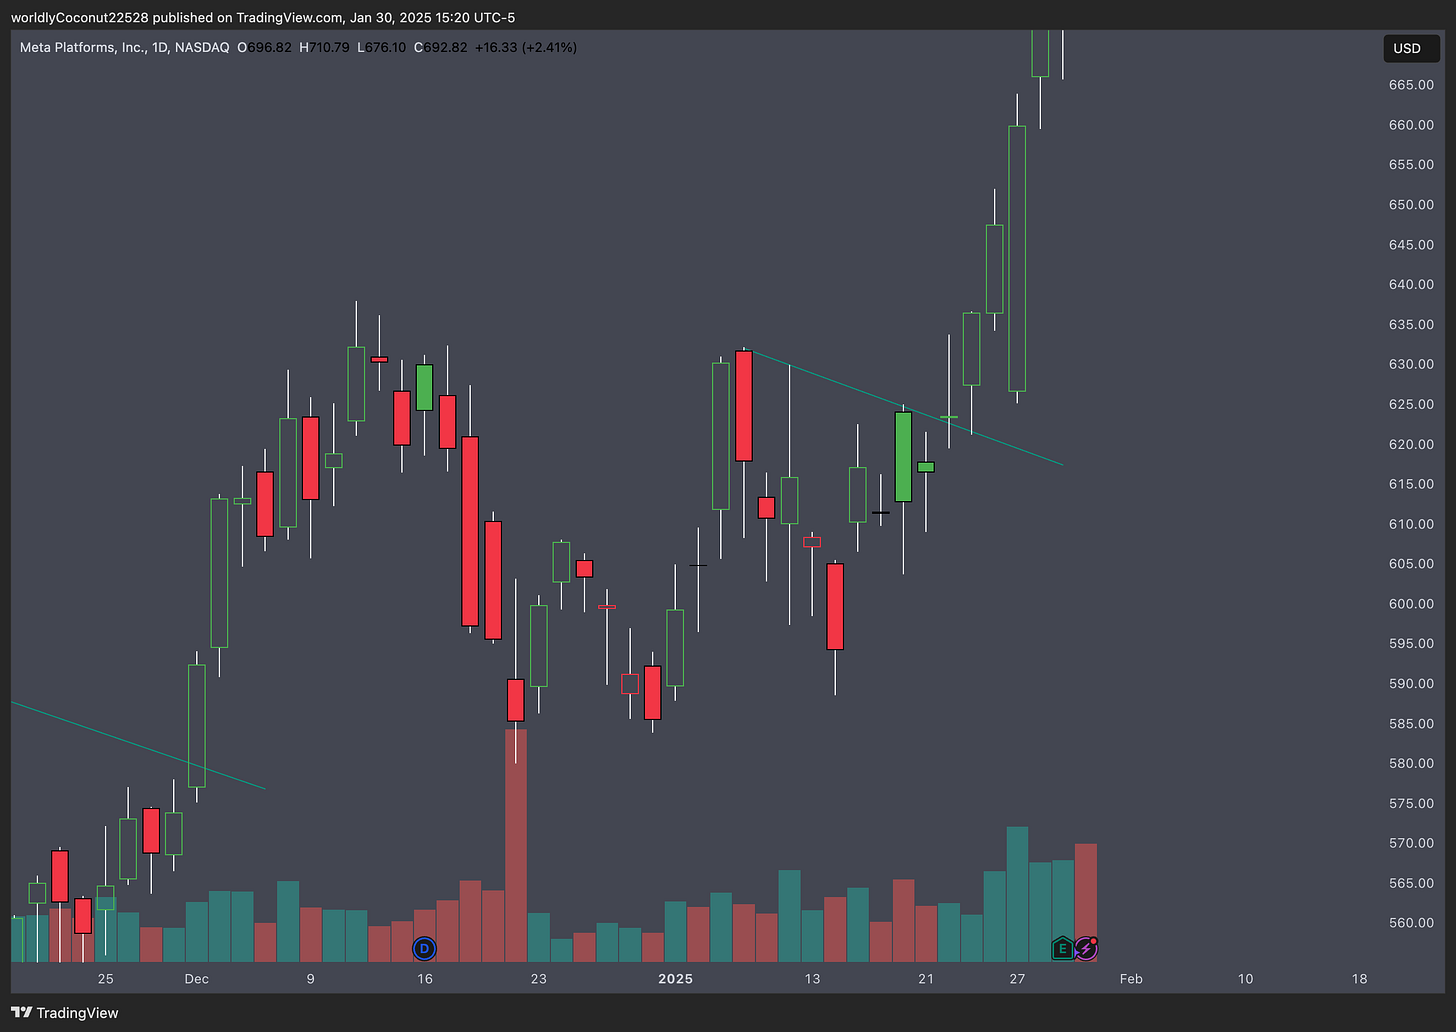
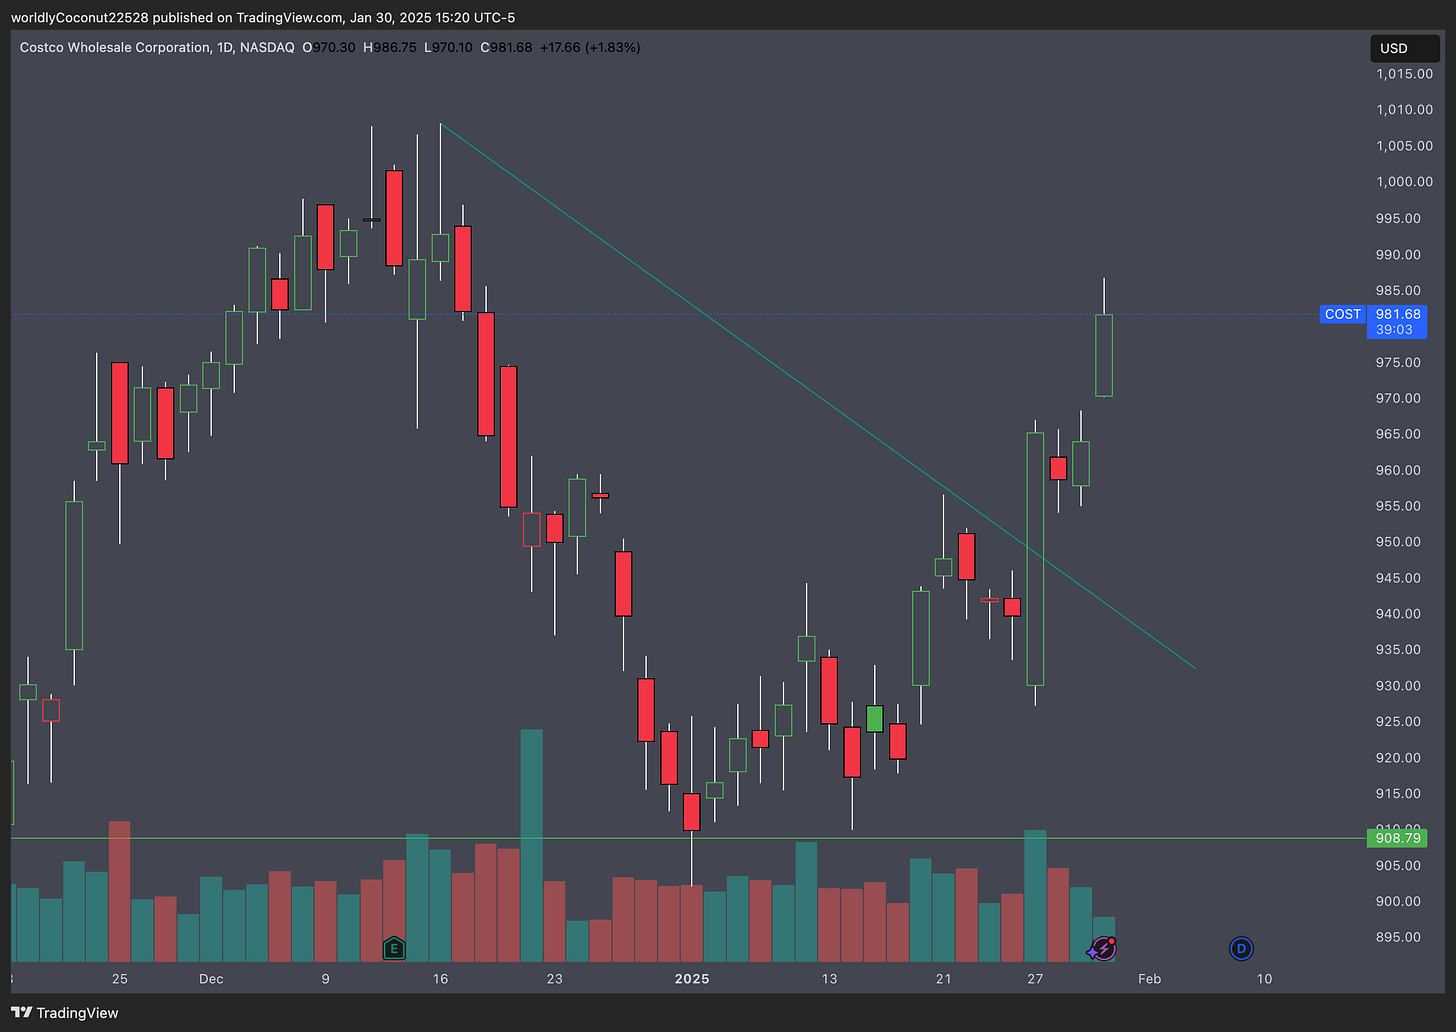
Drawing trend lines is another great tool to have for predicting confluence. Trend lines connect price points to help you identify the trend of price over a longer period of time.
Identifying potential trendline breaks is one of the most powerful ways to trade in the stock market to capture larger moves.
Trendline breaks come from:
Price consolidation—large buying volume sends price up to break the trendline and head to higher prices
This foundational knowledge of technical analysis is basically all you really need. Often times, retail traders will fill their screens with so many indicators that it becomes information overload. You want to make this process as easy as possible, the stock market itself is already super overwhelming with how much action happens. Why self impose more complications?
The next step is creating a checklist that you go over every time before entering a trade. You want to be able to check off every parameter for a trade before even putting the trade in. I love to think of taking a trade in the stock market as a business decision. You have to evaluate the risk, the potential pay out and what your plan is if things don’t go your way. We will cover this in Part 2!


