
Options Trading - Top Down Guide #2
Part 2- creating a trade plan

Welcome back to the my top down guide for options trading! Now that you know how to read charts and know what type of patterns you are looking for in the market, it’s time to learn how to execute on these observations.
Again, this is not financial advice and this is my personal journal of how I trade!
I like to see my trading as a company where every trade is an independent business decision. Like any business decision (regardless of what industry you’re in), you always analyze the ROI, risks to the decision and the time horizon. These are all factors that need to be considered before entering a trade too!
In Part 2, we’re going to cover:
→ Identifying entry/exits
→ Understanding option contracts

Entries & Exits
Every trade must have three requirements before even entering:
Entry
Exit A: Take profit
Exit B: Stop loss
Your exit on trades have only one of two outcomes, it’s very binary: either your take profit hits or your stop loss gets triggered.
These two examples below are real trades that I took by identifying trend line breaks and targeting previous resistance as covered in Part 1.
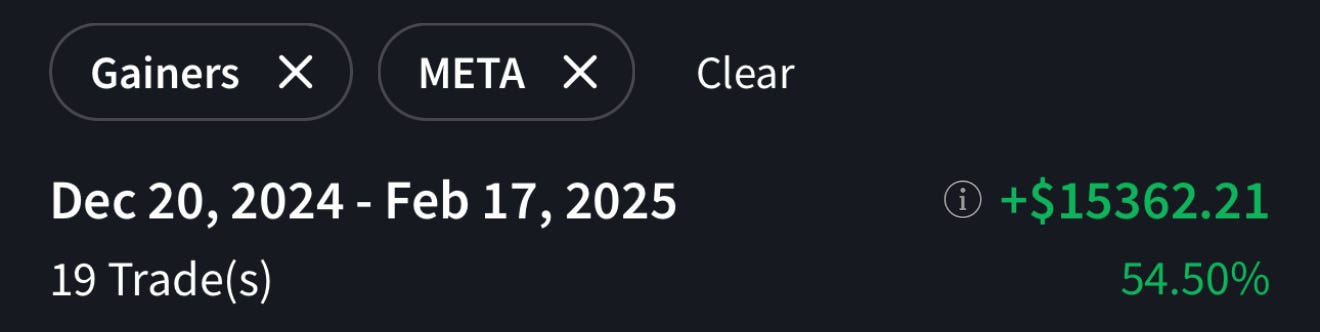
Let’s first take a look at META 0.00%↑, which was used in Part 1, and see where the action was.
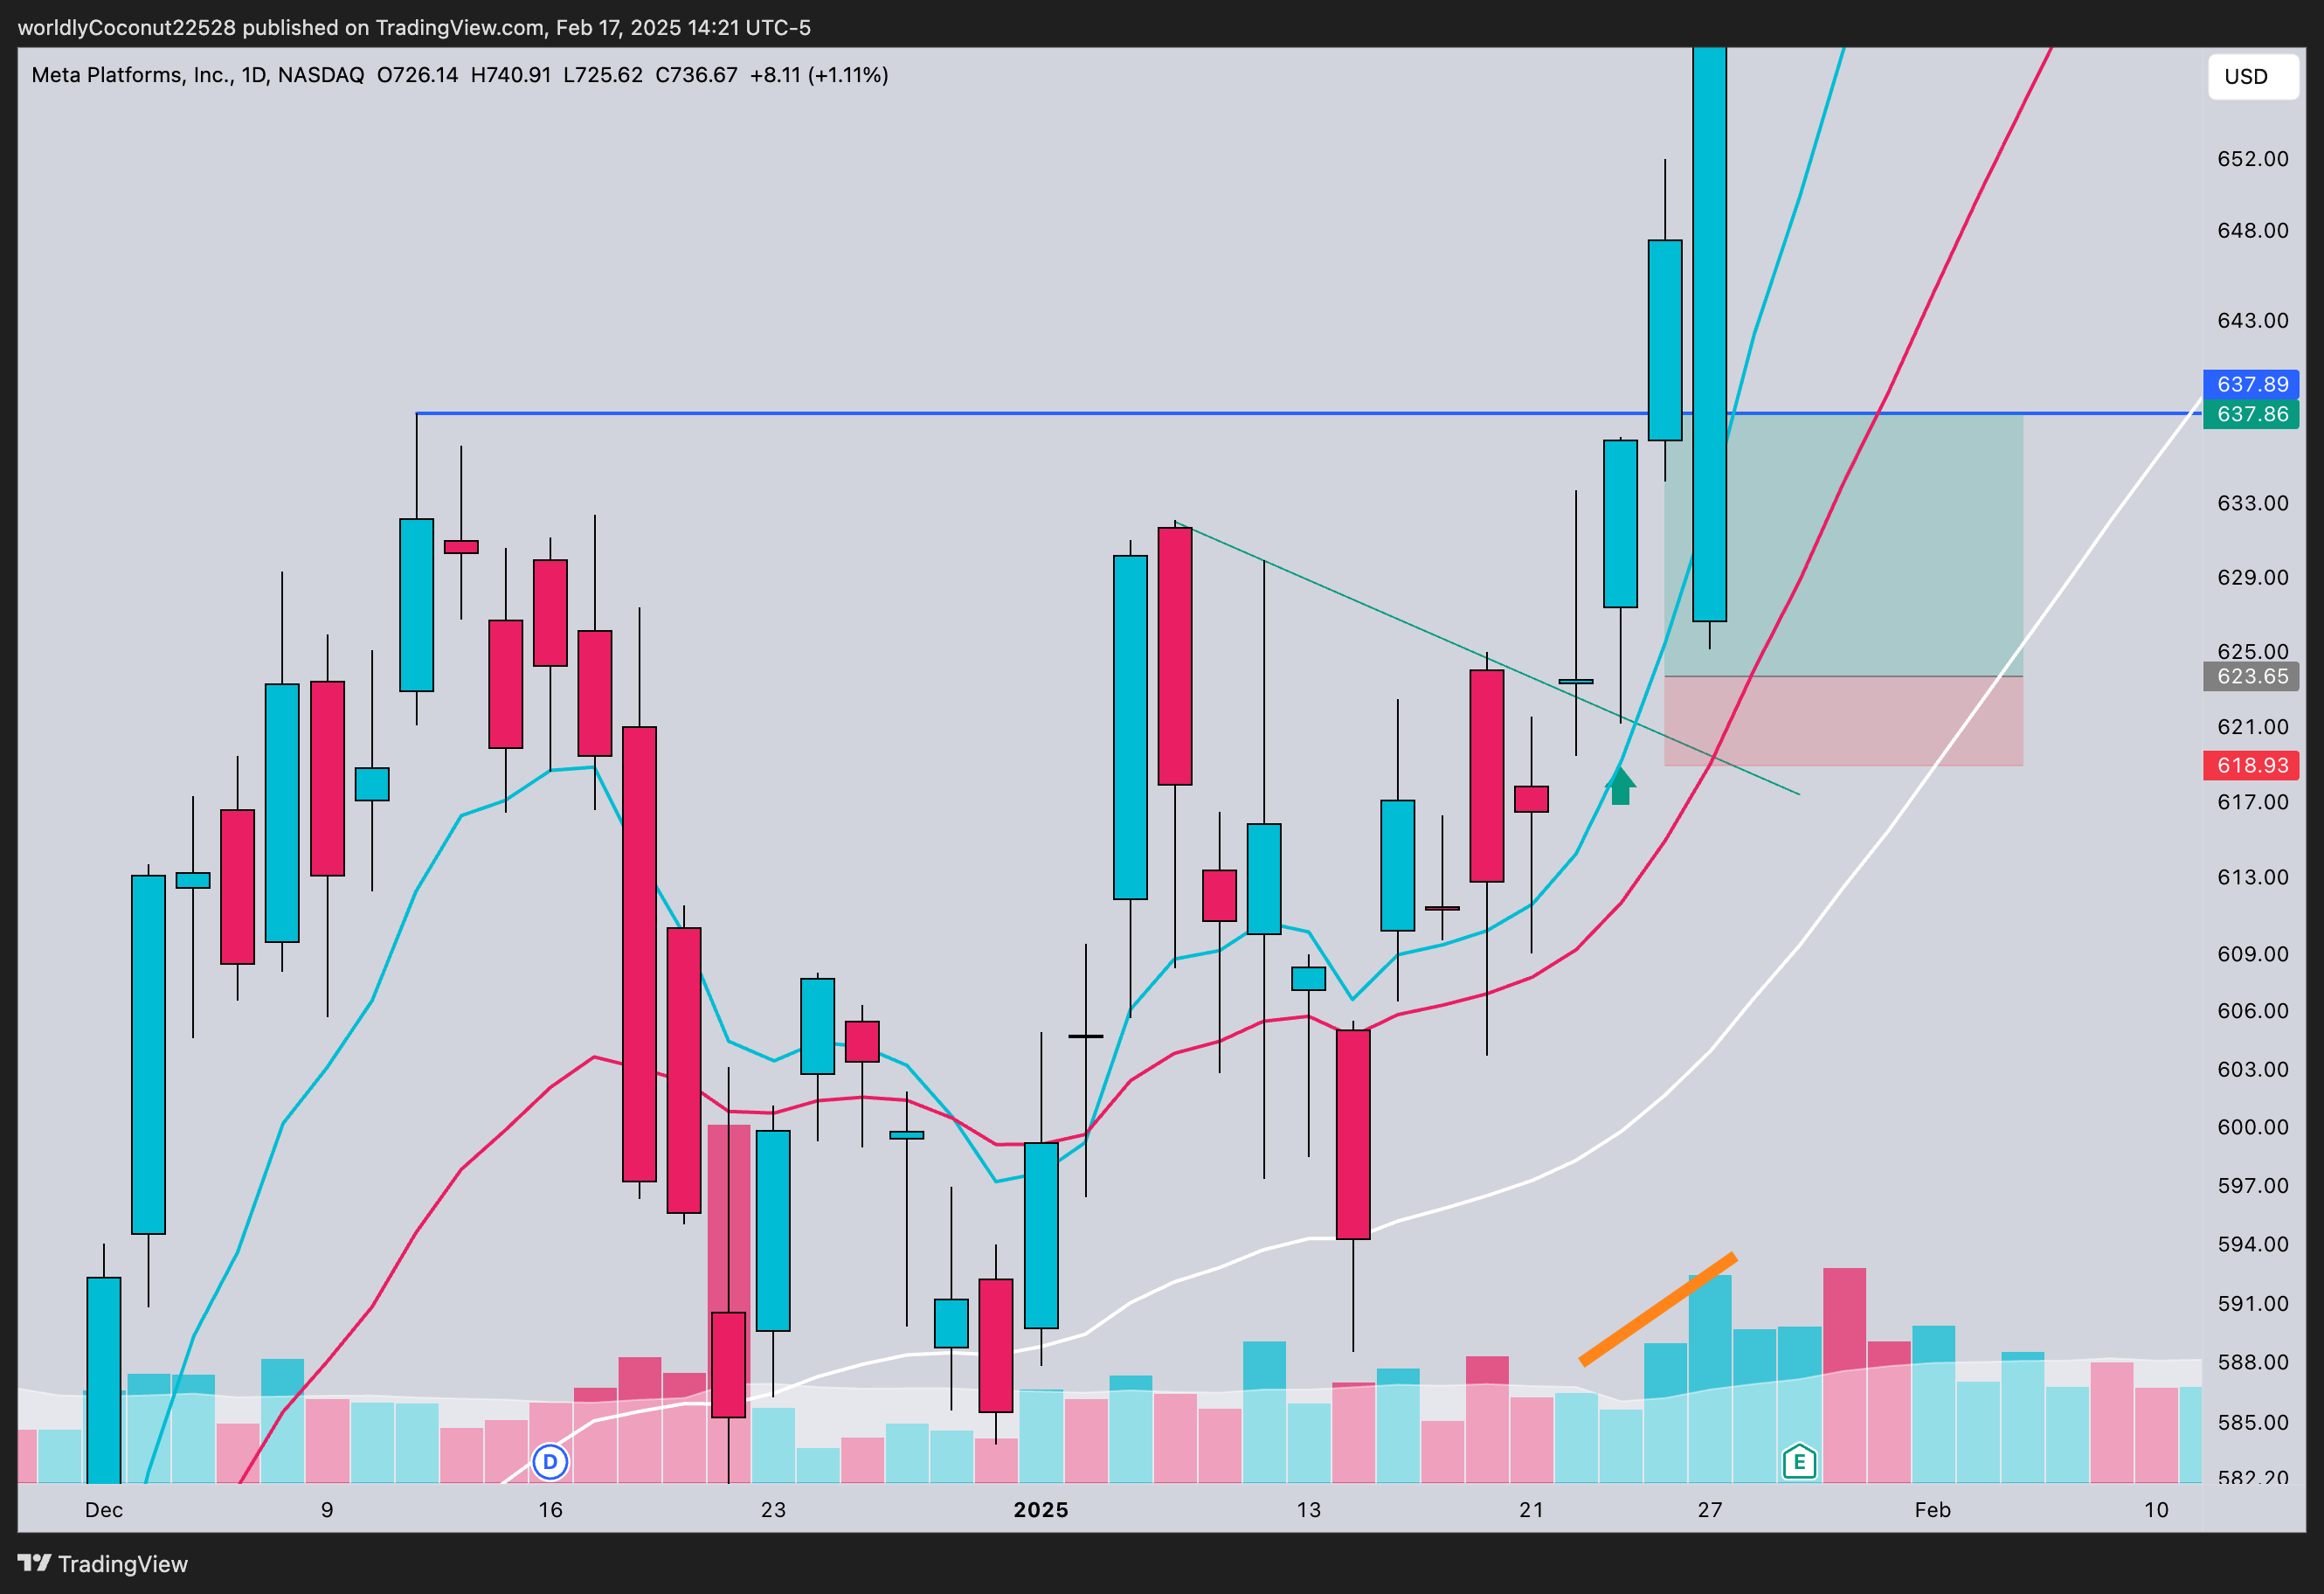
Remember, trend line breaks in price represent a status quo shift of what the market thinks is fair value. You confirm these moves through increased volume as price moves in one direction.
Entry on breakouts should be taken with large volume (to indicate higher chance of follow through) when price breaks past the break out zone (over the trend line for META).
On break out trades, a great take profit area is where previous resistance was on past price action. This level usually indicates strong selling pressure which is likely to be present again. For META 0.00%↑, that’s the blue horizontal line at $637.89.
For META 0.00%↑ specifically, the stop loss can be set at a daily candle close back under the trend line from where price broke out. Failure to have price hold above the trend line likely represents a failed breakout.
A lot of traders tend to overthink/overanalyze their trades when they are in the twilight zone where price isn’t near their take profit nor is it near their stop loss. Getting through this hurdle takes time and confidence in your system that you’re trading.
Here’s another great example of trading a trend line break even after a stock has gapped up and ran.
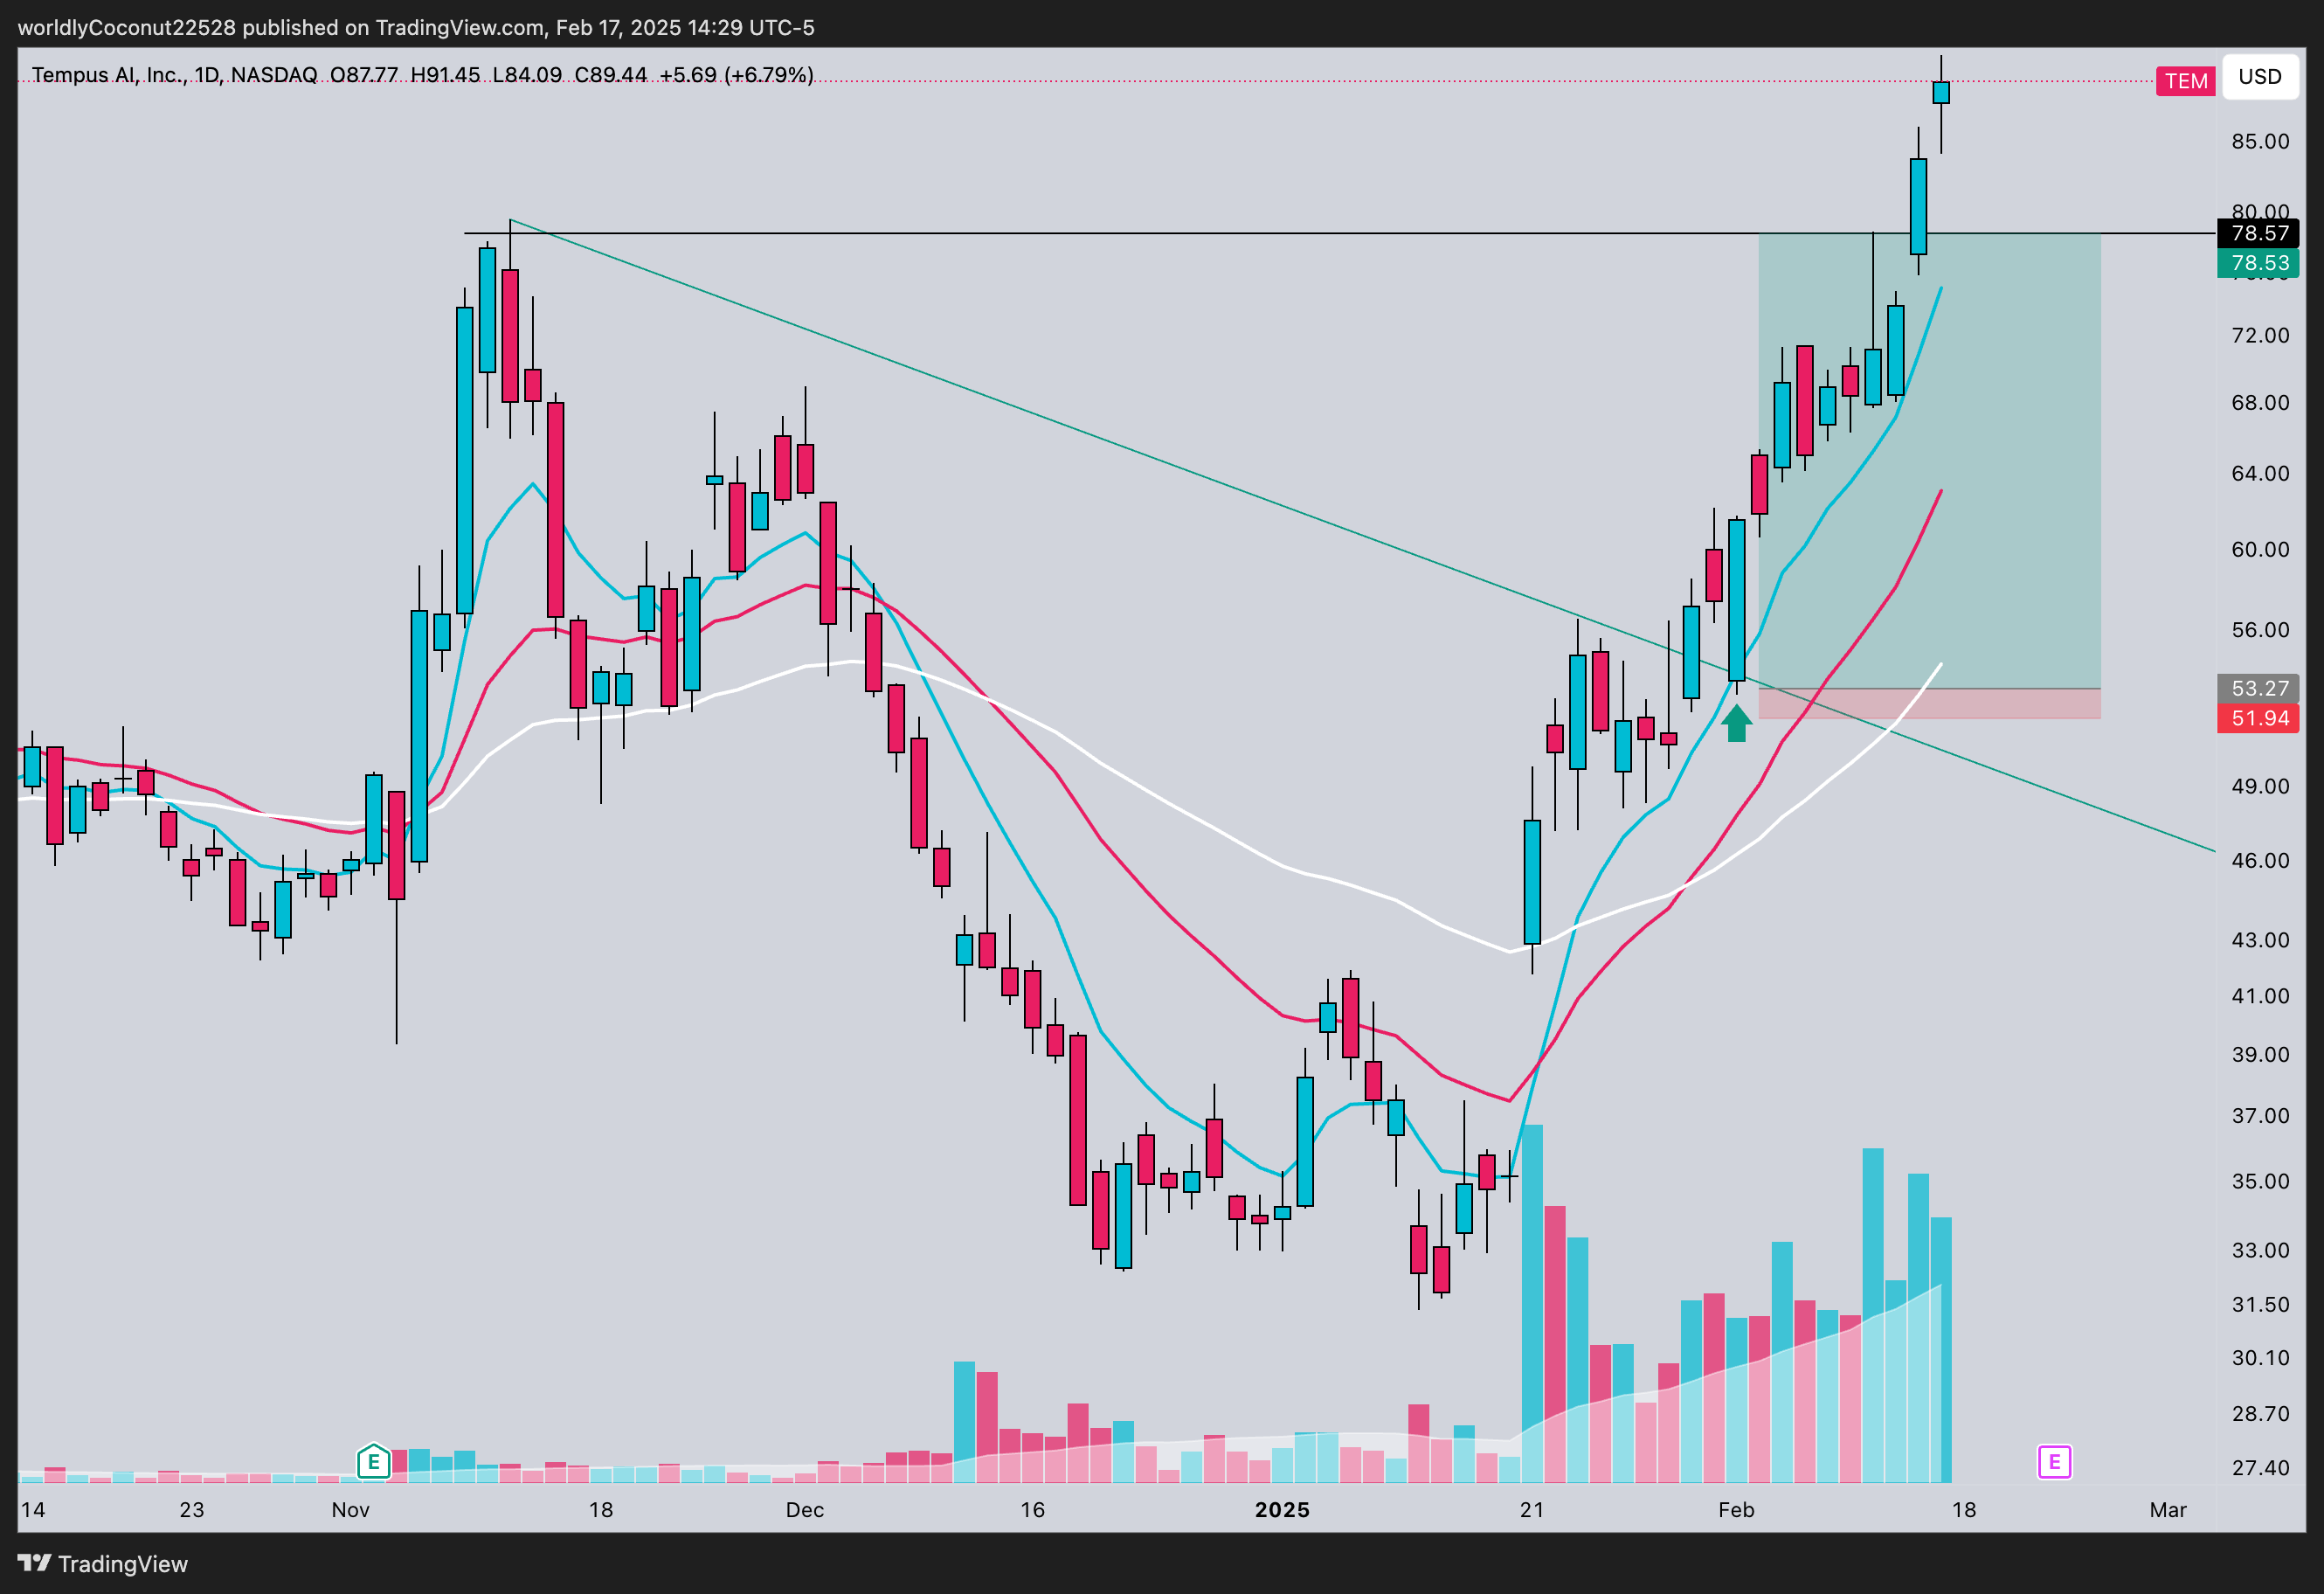
Price for the most part always moves in ebbs and flows. You want to avoid FOMO’ing into something just because price is going up. You want to see price consolidation and the price structure tightening.
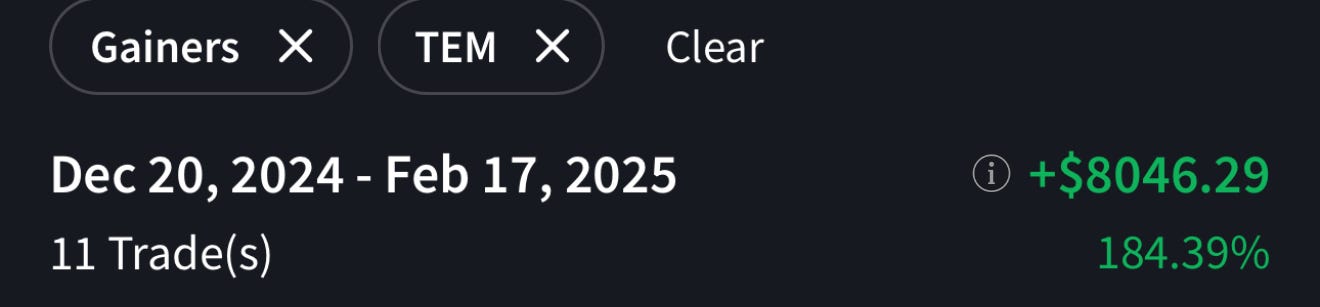
TEM 0.00%↑ gapped and ran a bit before beginning to consolidate at these new price levels. Consolidation at higher levels indicate higher chances of continuation in the near future. This is because buyers and sellers agree the new higher level is a fair price to pay for the specific stock.
A perfect take profit target is the black line on the chart at around $78.57. This is where price black in November failed to break out and continue higher from. The large red daily candle on the left side of the chart actually shows a wick off the $78 level. Again, like META 0.00%↑, this is interpreted as strong selling pressure, thus bringing price down. This is price resistance! It’s likely to see price have a pitstop at that level again before continuing higher if the market is willing. Coincidentally, that’s exactly what happened in this trade where price actually wicked at exactly that level.
It won’t always be a perfect touch of price so it’s wise to set your take profit a little under resistance. You have to remember that the price you see on your chart is relatively the mid price between the bid and ask on the underlying asset.
These types of price structures occur every day on multiple time frames. Identifying and then executing on these patterns provides some clarity on where price can potentially go instead of aimlessly throwing darts and seeing what sticks.
Understanding Option Contracts
Here’s the quick run down on prerequisites of what you should know about option contracts before even touching one:
→ The nerdy financial knowledge:
Options contracts are financial derivatives that give the buyer the right but not obligation to buy/sell 100 shares of the underlying asset at a predetermined price (strike) by the expiration date.
Buying calls are bullish trading instruments while buying puts are bearish trading instruments.
There are American style options and European style options contracts. The biggest difference is that European style options can only be exercised at expiration whereas American options can be exercised anytime before expiration.
Option prices are roughly calculated via the Black Scholes formula.
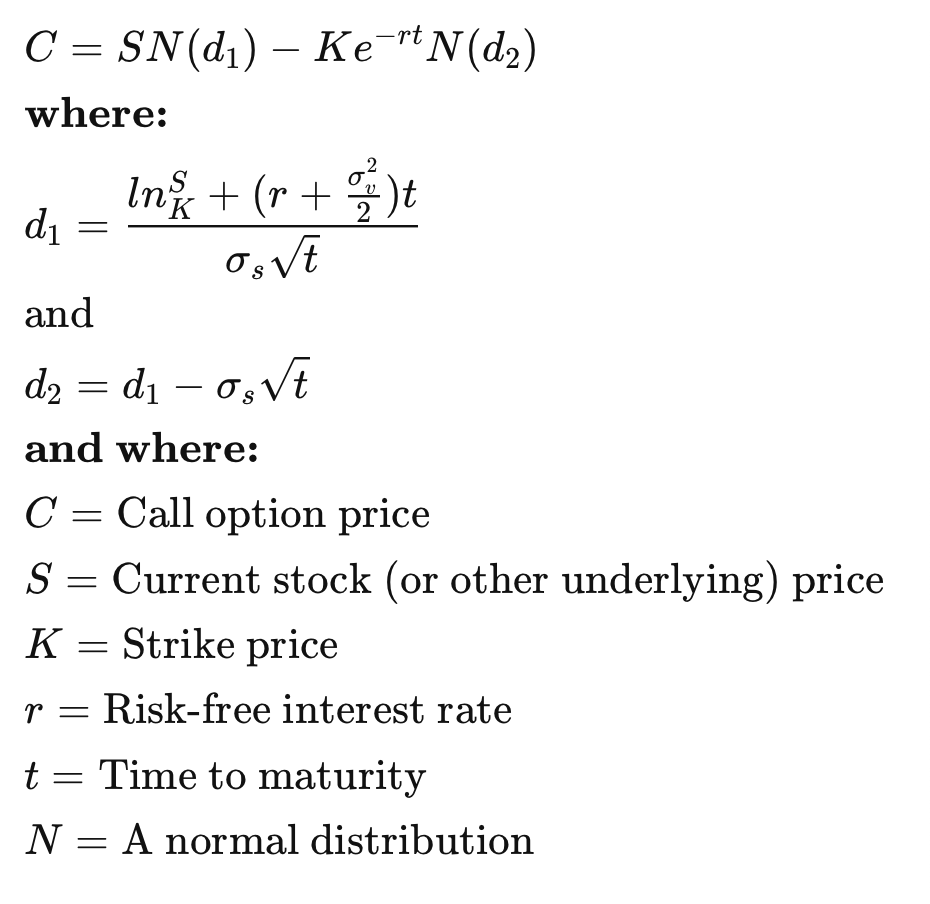
Although the formula is used for European style options, they can still be quasi utilized for American options for stocks that don’t have dividends. There is an altered formula that’s used for American options for stocks that do have dividends.
→ What to know for option trading
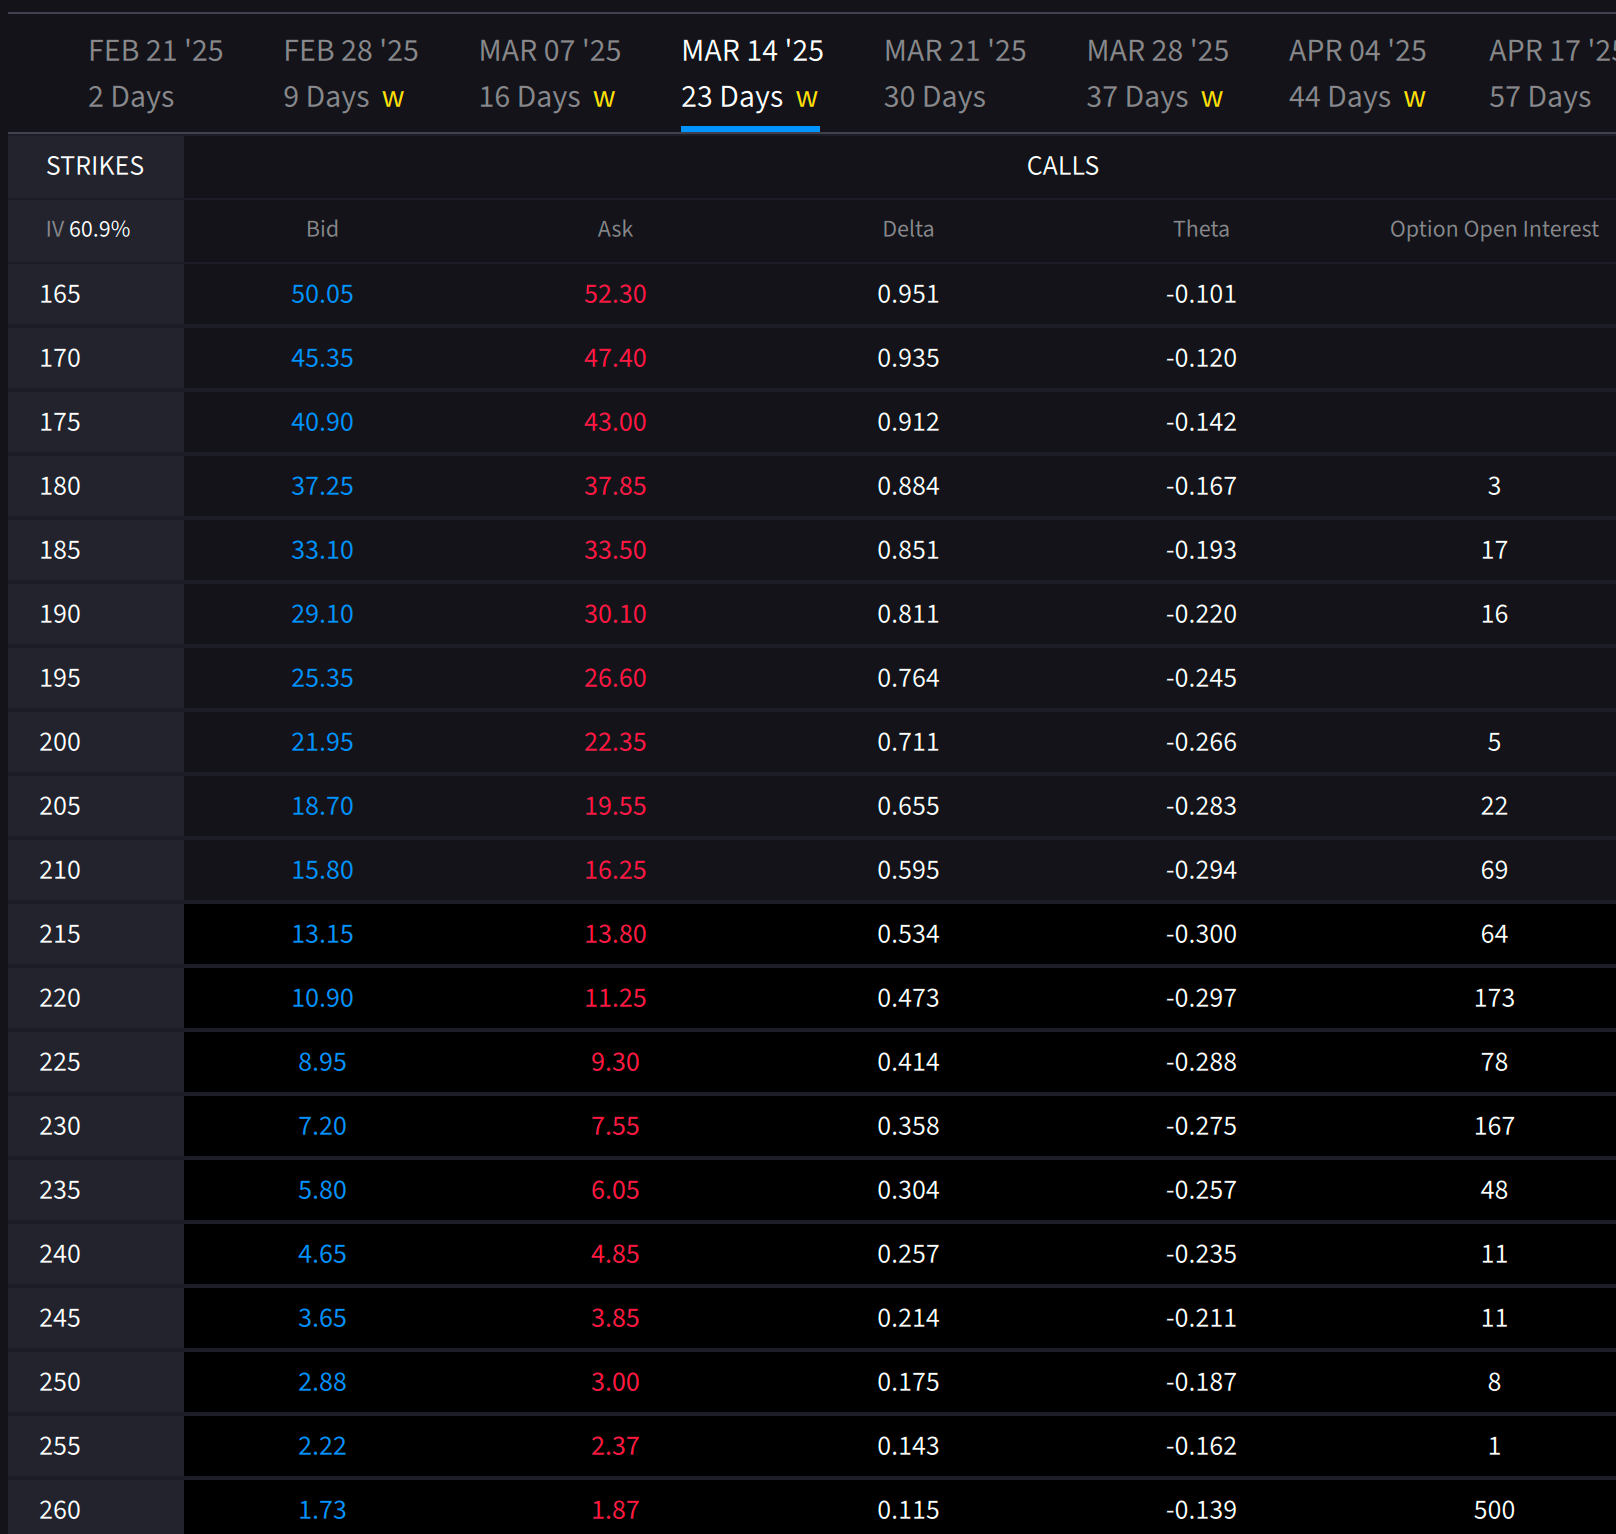
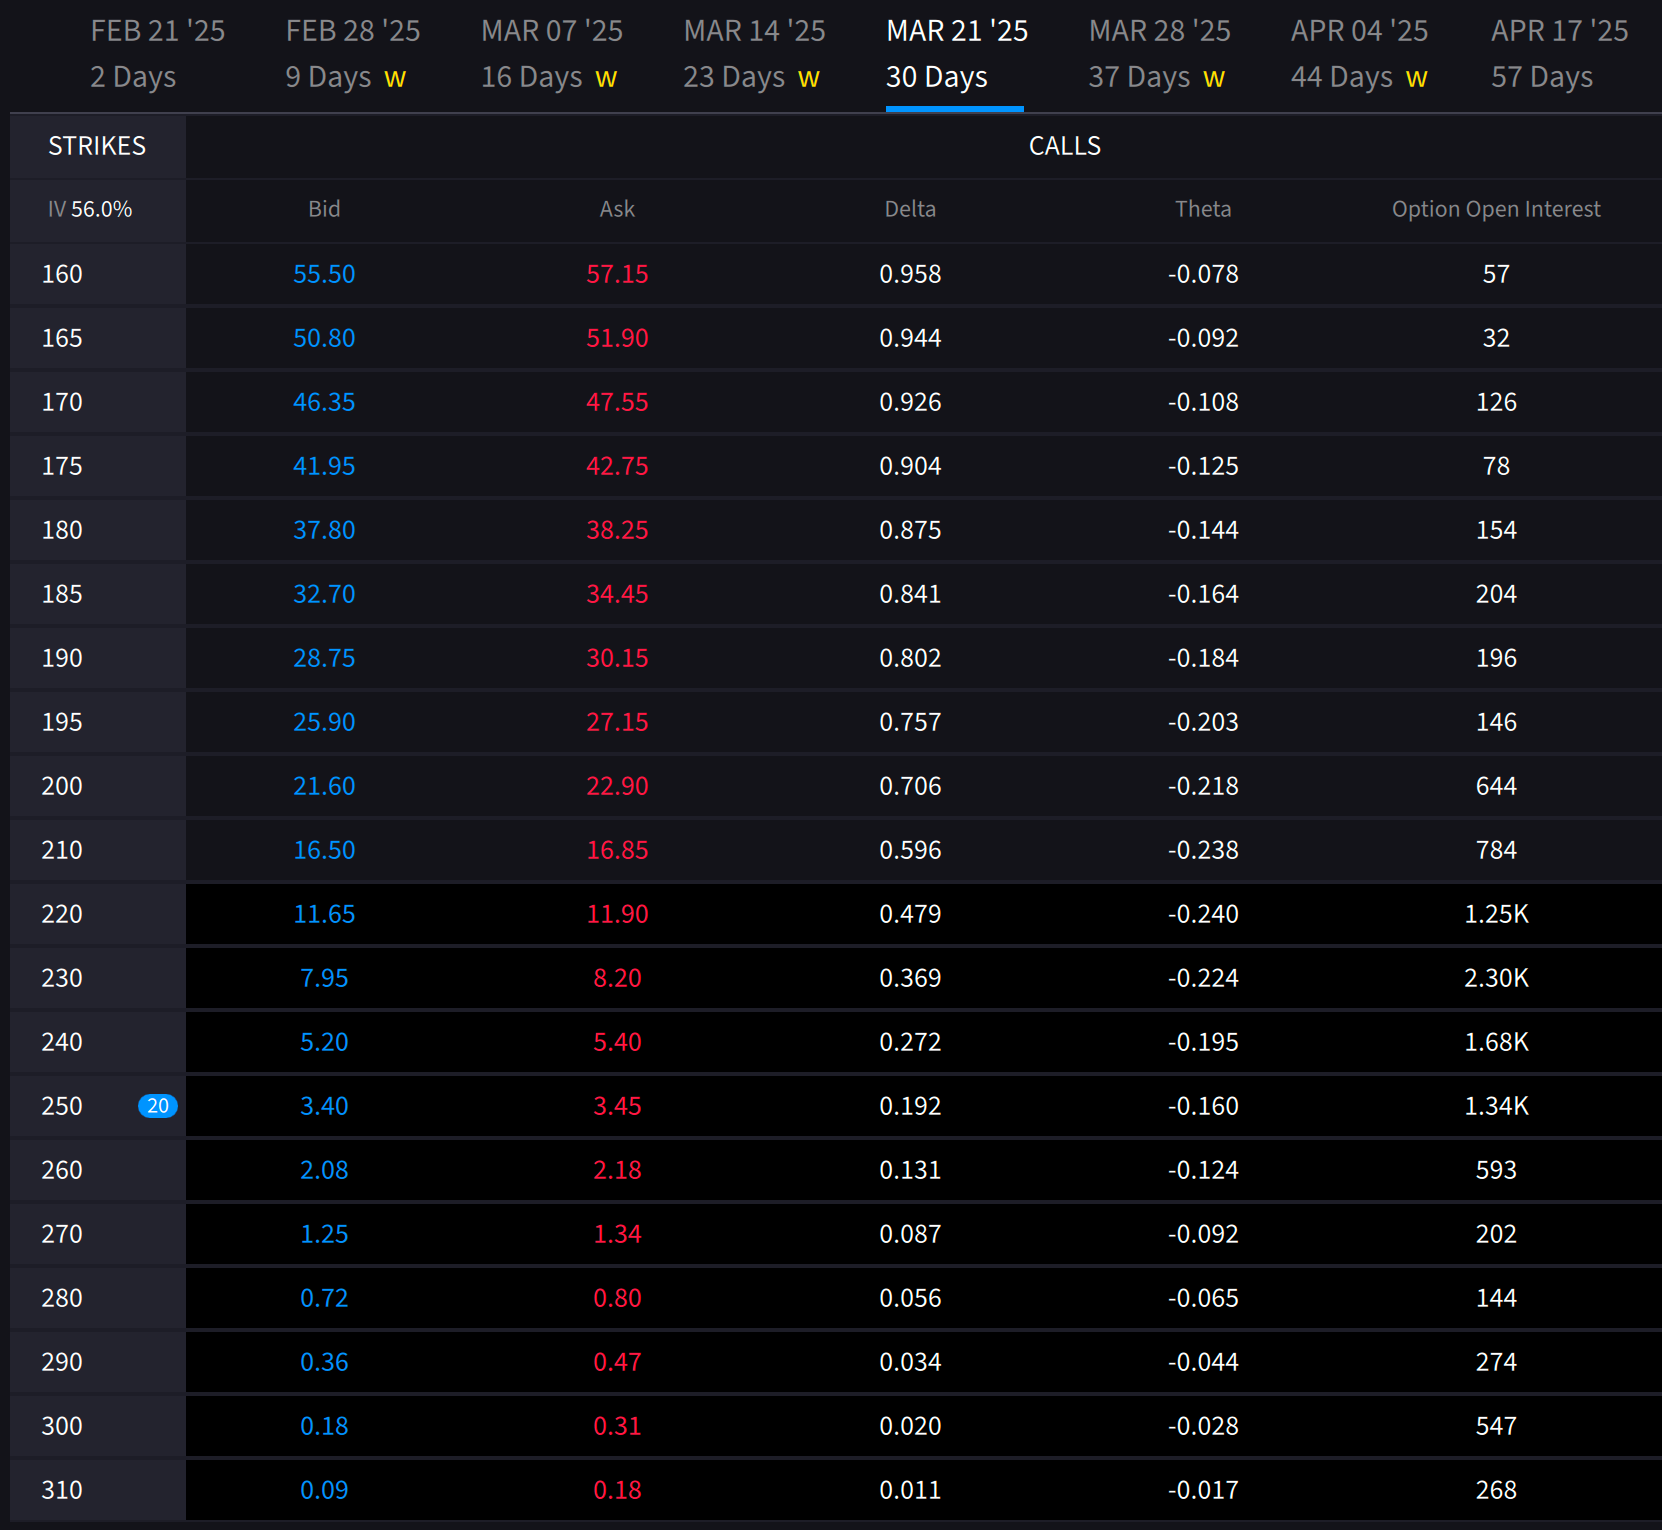
Let’s use: ZS 0.00%↑ 3/21/2025 250C 3.45 fill
March 21st 2025 is the expiration of the option contract
250C represents the strike price of 250 and C is a call
Price of these option contracts will be shown as 3.45, total cost to purchase a contract 3.45 would be: 3.45 * 100 = $345
Options always have monthly options expiration (MOPEX), which is always the third Friday of each month. These expiration date contracts are the ones you should usually always go for. This is because MOPEX option contracts are more liquid and better open interest (OI).
Open interest is the number of option contracts that are still being held without closing/exercising. See below the stark contrast of the OI from 3/14 to 3/21, which is March’s MOPEX. You’ll also notice that the bid and ask are tighter for MOPEX contracts.
The Greeks
All option contracts have metrics that influence the option price. Because of these factors, the option contract value with never perfectly reflect the underlying’s price.
Probably the most important two to know are Delta and Theta, we’ll continue using the 3/21 250C as reference.
Delta:
Represents the option value change based on $1 change in the underlying asset
Puts would show i.e. -0.20 delta, meaning the put contract value increases by $20 per $1 decrease
Acts almost as a proxy for probability of expiring ITM, the 250C shows a 19% chance of expiring ITM
The ZS 0.00%↑ 3/21 250C delta is 0.192, meaning the contract value will move roughly $19 per $1 move on Zscaler’s stock price.
Theta:
Infamously known as time decay because it measures the option contract’s decrease in value due to time (if all else constant)
The 250C contract’s theta of -0.16 represents a decrease of $16 in value daily
Time decay accelerates exponentially as you approach expiration if the underlying asset’s price fails to move towards the direction where the option will go in the money (ITM)
Part 3 will be a continuation of option contracts and further knowledge, make sure you’re tagging along!