
Mastering the Pullback: How to Use Fibonacci Retracements Like a Pro

In a world of trading filled with complex concepts like Fair Value Gaps (FVGs) and market imbalances, simplicity is extremely under-rated and not appreciated enough. Credited after the 13th century Italian Mathematician Leonardo Bonacci, the Fibonacci Retracement is a powerful tool that can help you as a trader gain confluence on key levels.
Today, we’re going to look at how Fibonacci retracements can simplify your trading to nail down entries, exits and risk manage properly.
How do the Levels Work? 📐
Remember, the stock market moves in peaks and troughs. It’s never a singular direction move forever. This is because the stock market is driven by human behavior, which involves greed and fear. These two key factors lead to profit-taking, liquidity traps and these explain how a stock moves.
You must be wondering, isn’t the market propped up by algos and machine learning? While this may be true for micro movements you see intraday, behind EVERY algo or program is a human programmer. Market movements still relatively follow how market participants as a whole react to news or price levels.
The golden ratio is at 1.618, which is from the Fibonacci sequence and how every number divided by the one before it eventually converges to 1.618. This is a naturally occurring mathematical pattern found in everything from pinecones to financial markets. Fibonacci retracements don’t give you guarantees, but they provide high probability levels that you can use for your trades.
And so, in trading, the most common retracement levels are: 23.6%, 50%, and 61.8% (0.618 is inverse of 1.618). These areas are where price can potentially react very aggressively. Most importantly, the 0.618 is the golden retracement, where price often reacts.
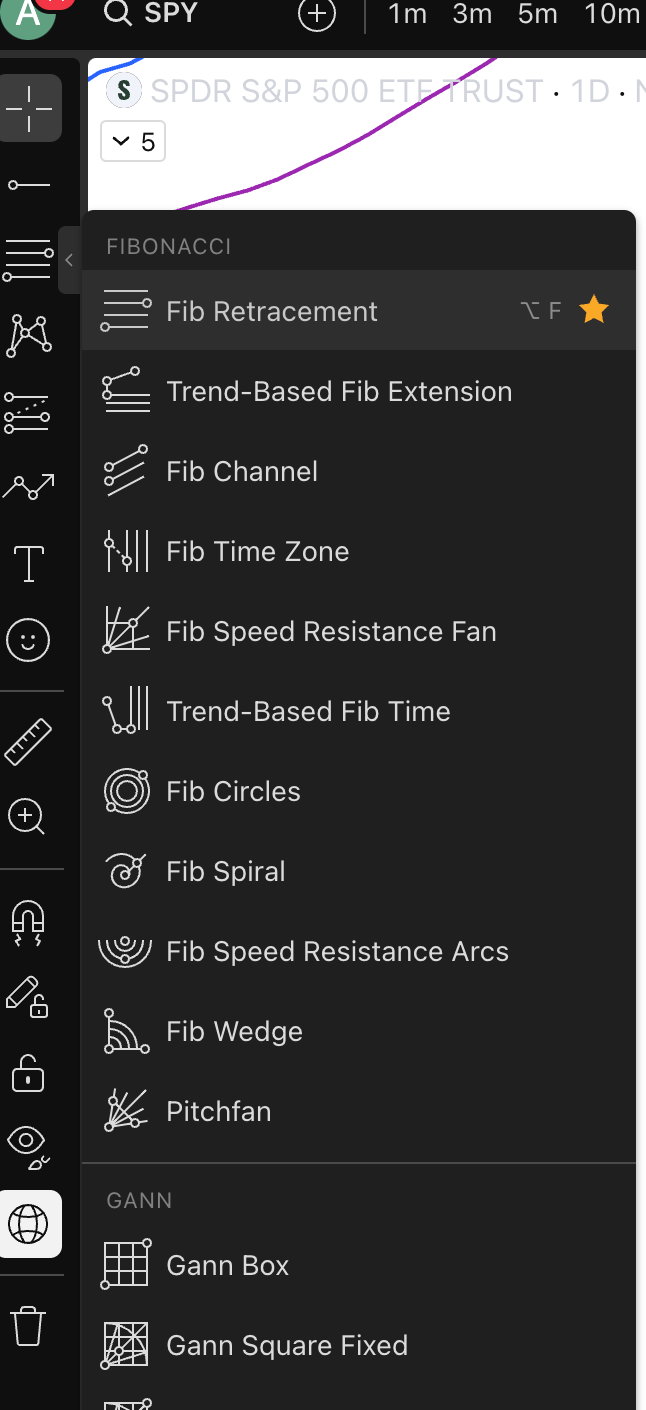
Here are the settings on TradingView for Fib Retracement:

When to Use Fibs?
Before applying fibs, you need to first identify the market trend. This is easy to do on the daily or weekly time frame and see whether the market is in an uptrend or downtrend.
Uptrend - higher highs and lower lows

Downtrend - lower highs and higher lows
Once you identify the market trend, use the Fib Retracement tool on TradingView.
Mark the swing high and swing low of the market move as reference points.
My go to rules are the following
Retracement: 0.618
Extension: 1.236, 1.5, 1.618

Let’s use an uptrend as reference. In uptrends, you should be watching for pullbacks to the .618 golden zone as a potential reversal spot. This helps you get better entries instead of just chasing a stock that doesn’t seem to stop going up. Your stop loss would be candle closes under the golden zone, depending on the time frame you’re on. The profit targets that work well for me are at the 1.0, 1.236, and 1.618 extensions.
So technically, fibs can work on any time frame but they will be way more reliable on the larger time frames.
Let’s look at some examples:

The retracement on Broadcom starts at the swing high at 186.89 to the swing low at 137.78. Price consolidated and worked on a reversal after the pullback near the 0.618 zone at 168.13. Positioning long near this area means you could have targeted 1.236 at 198.48 and then 1.618 at 217.24.

This is even cleaner of an example. Swing high and swing low from 183.9 to 142.58, with the golden zone at 168.12. Price almost perfectly bounces off this level twice before breaking out to the 1.236 and then pit stopped for a while at exactly the 1.618 extension at 209.44.
Downsides?
A common critique of Fibonacci retracement is subjectivity. What you see as potential swing highs and swing lows can vary dramatically from what I see in the market. This can be problematic because golden zones will be different depending on what time frame and what trend you think is there. The important thing to remember is that no single indicator should be dictating how you trade, you should always use these tools in congruence with other characteristics in market to fit your thesis on a trade.
“The golden zone represents a probable area to bounce as it was also a previous resistance price level that has now become new support. There was also high volume when price originally broke past this point.”
Use volume, macro conditions and previous price levels along with Fibonacci retracements to create the highest probable set up.
Fibonacci retracements can also create false positives, where price touches the golden zone but then later fails to hold this level. So, it’s important to wait for candle closes and prioritize higher time frame candle closes.
Retracements are also more reliable in trending markets whereas price doesn’t respect the retracement zones as much in choppy markets. Logically, this makes sense as choppier market conditions imply uncertain market participants. Thus, price action will be frothy and trivial. It’s always best to wait for the right market condition to put your foot on the gas pedal.
